 Genestack Genome Browser is designed to make it comfortable for you to work with your data. We added the ability to customise graph tracks this week, to prepare your view for further analysis or for sharing it with your colleagues. Don't overlook the quite special feature of being able to do computations right on the genome browser. It's just the start of what we think is possible within this tool.
 Coverage track
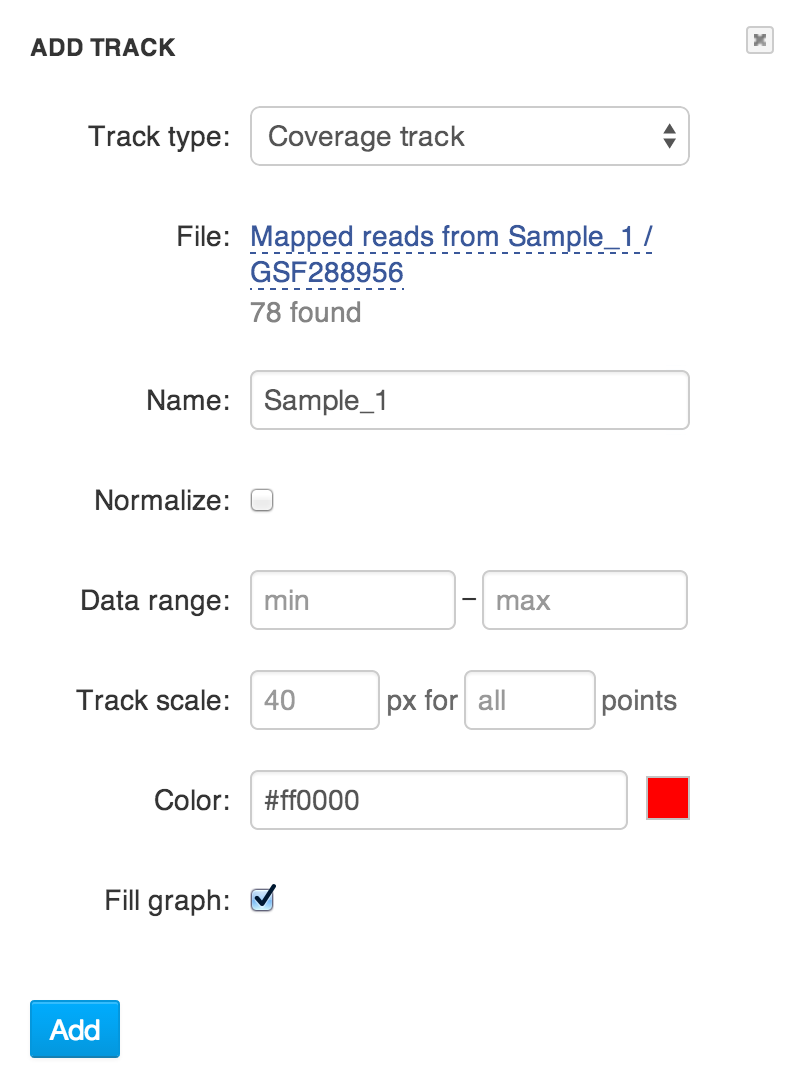 One of the data types that can be represented as a graph track is reads coverage for Aligned and Mapped Reads files. To create a coverage track select it in Track creation dialog and choose a source data file.
 You can also create a coverage track directly from an Aligned and Mapped Reads file by opening it with the Genome Browser from anywhere in the system.
Coverage values can be shown "as is", or you can turn on global normalisation with the Normalize option: every point will be divided by 1,000,000 * total read count.
You can set custom Color and Fill properties to control how the graph looks.
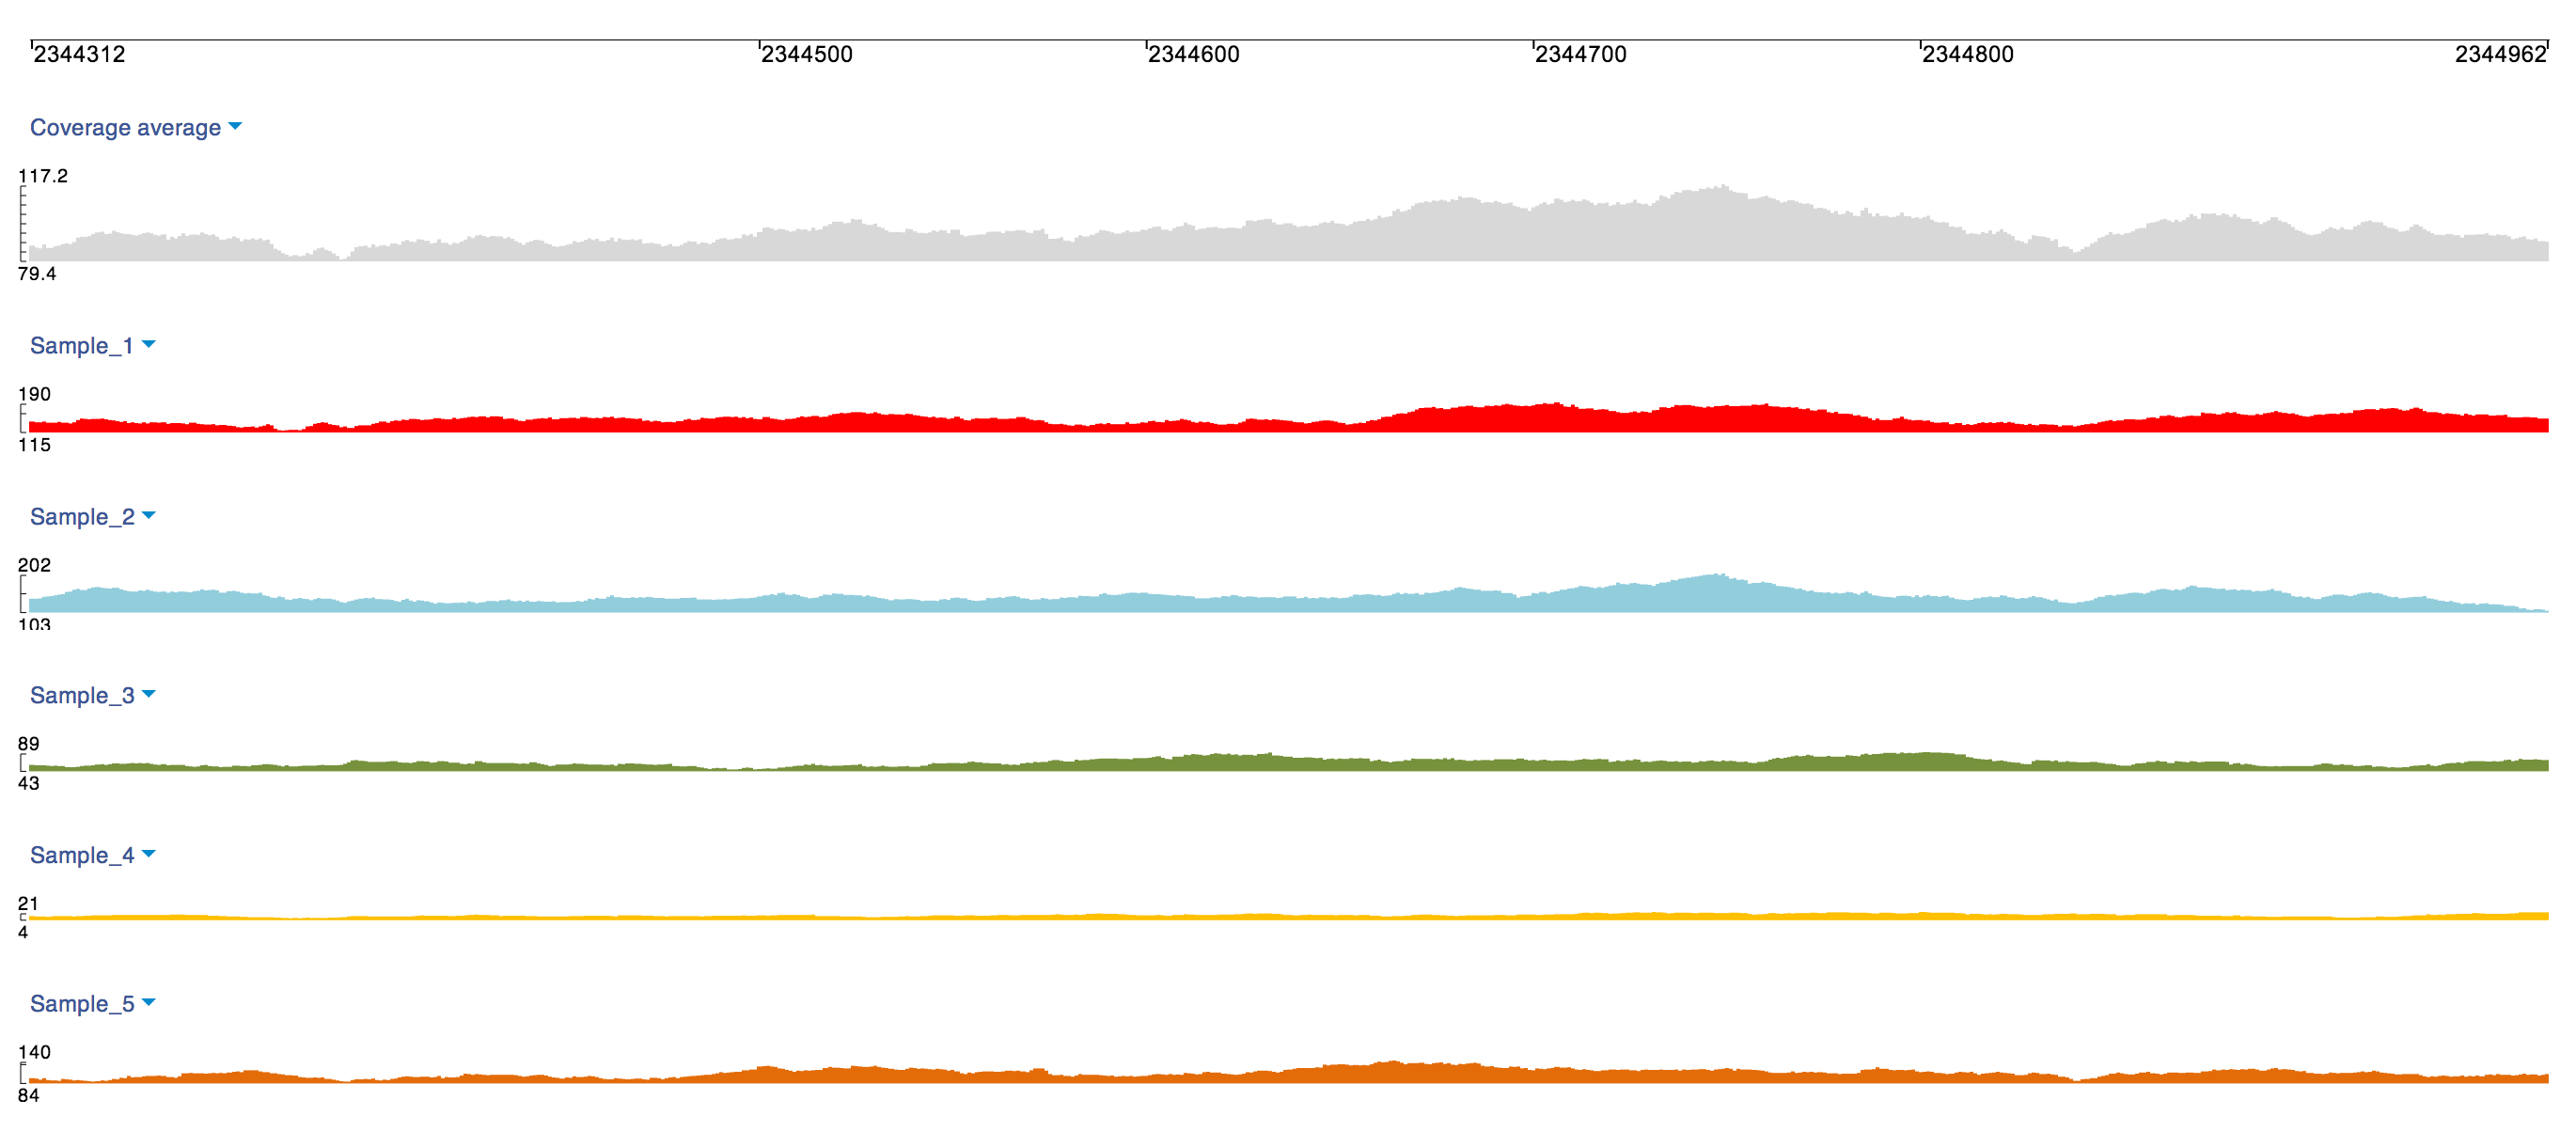
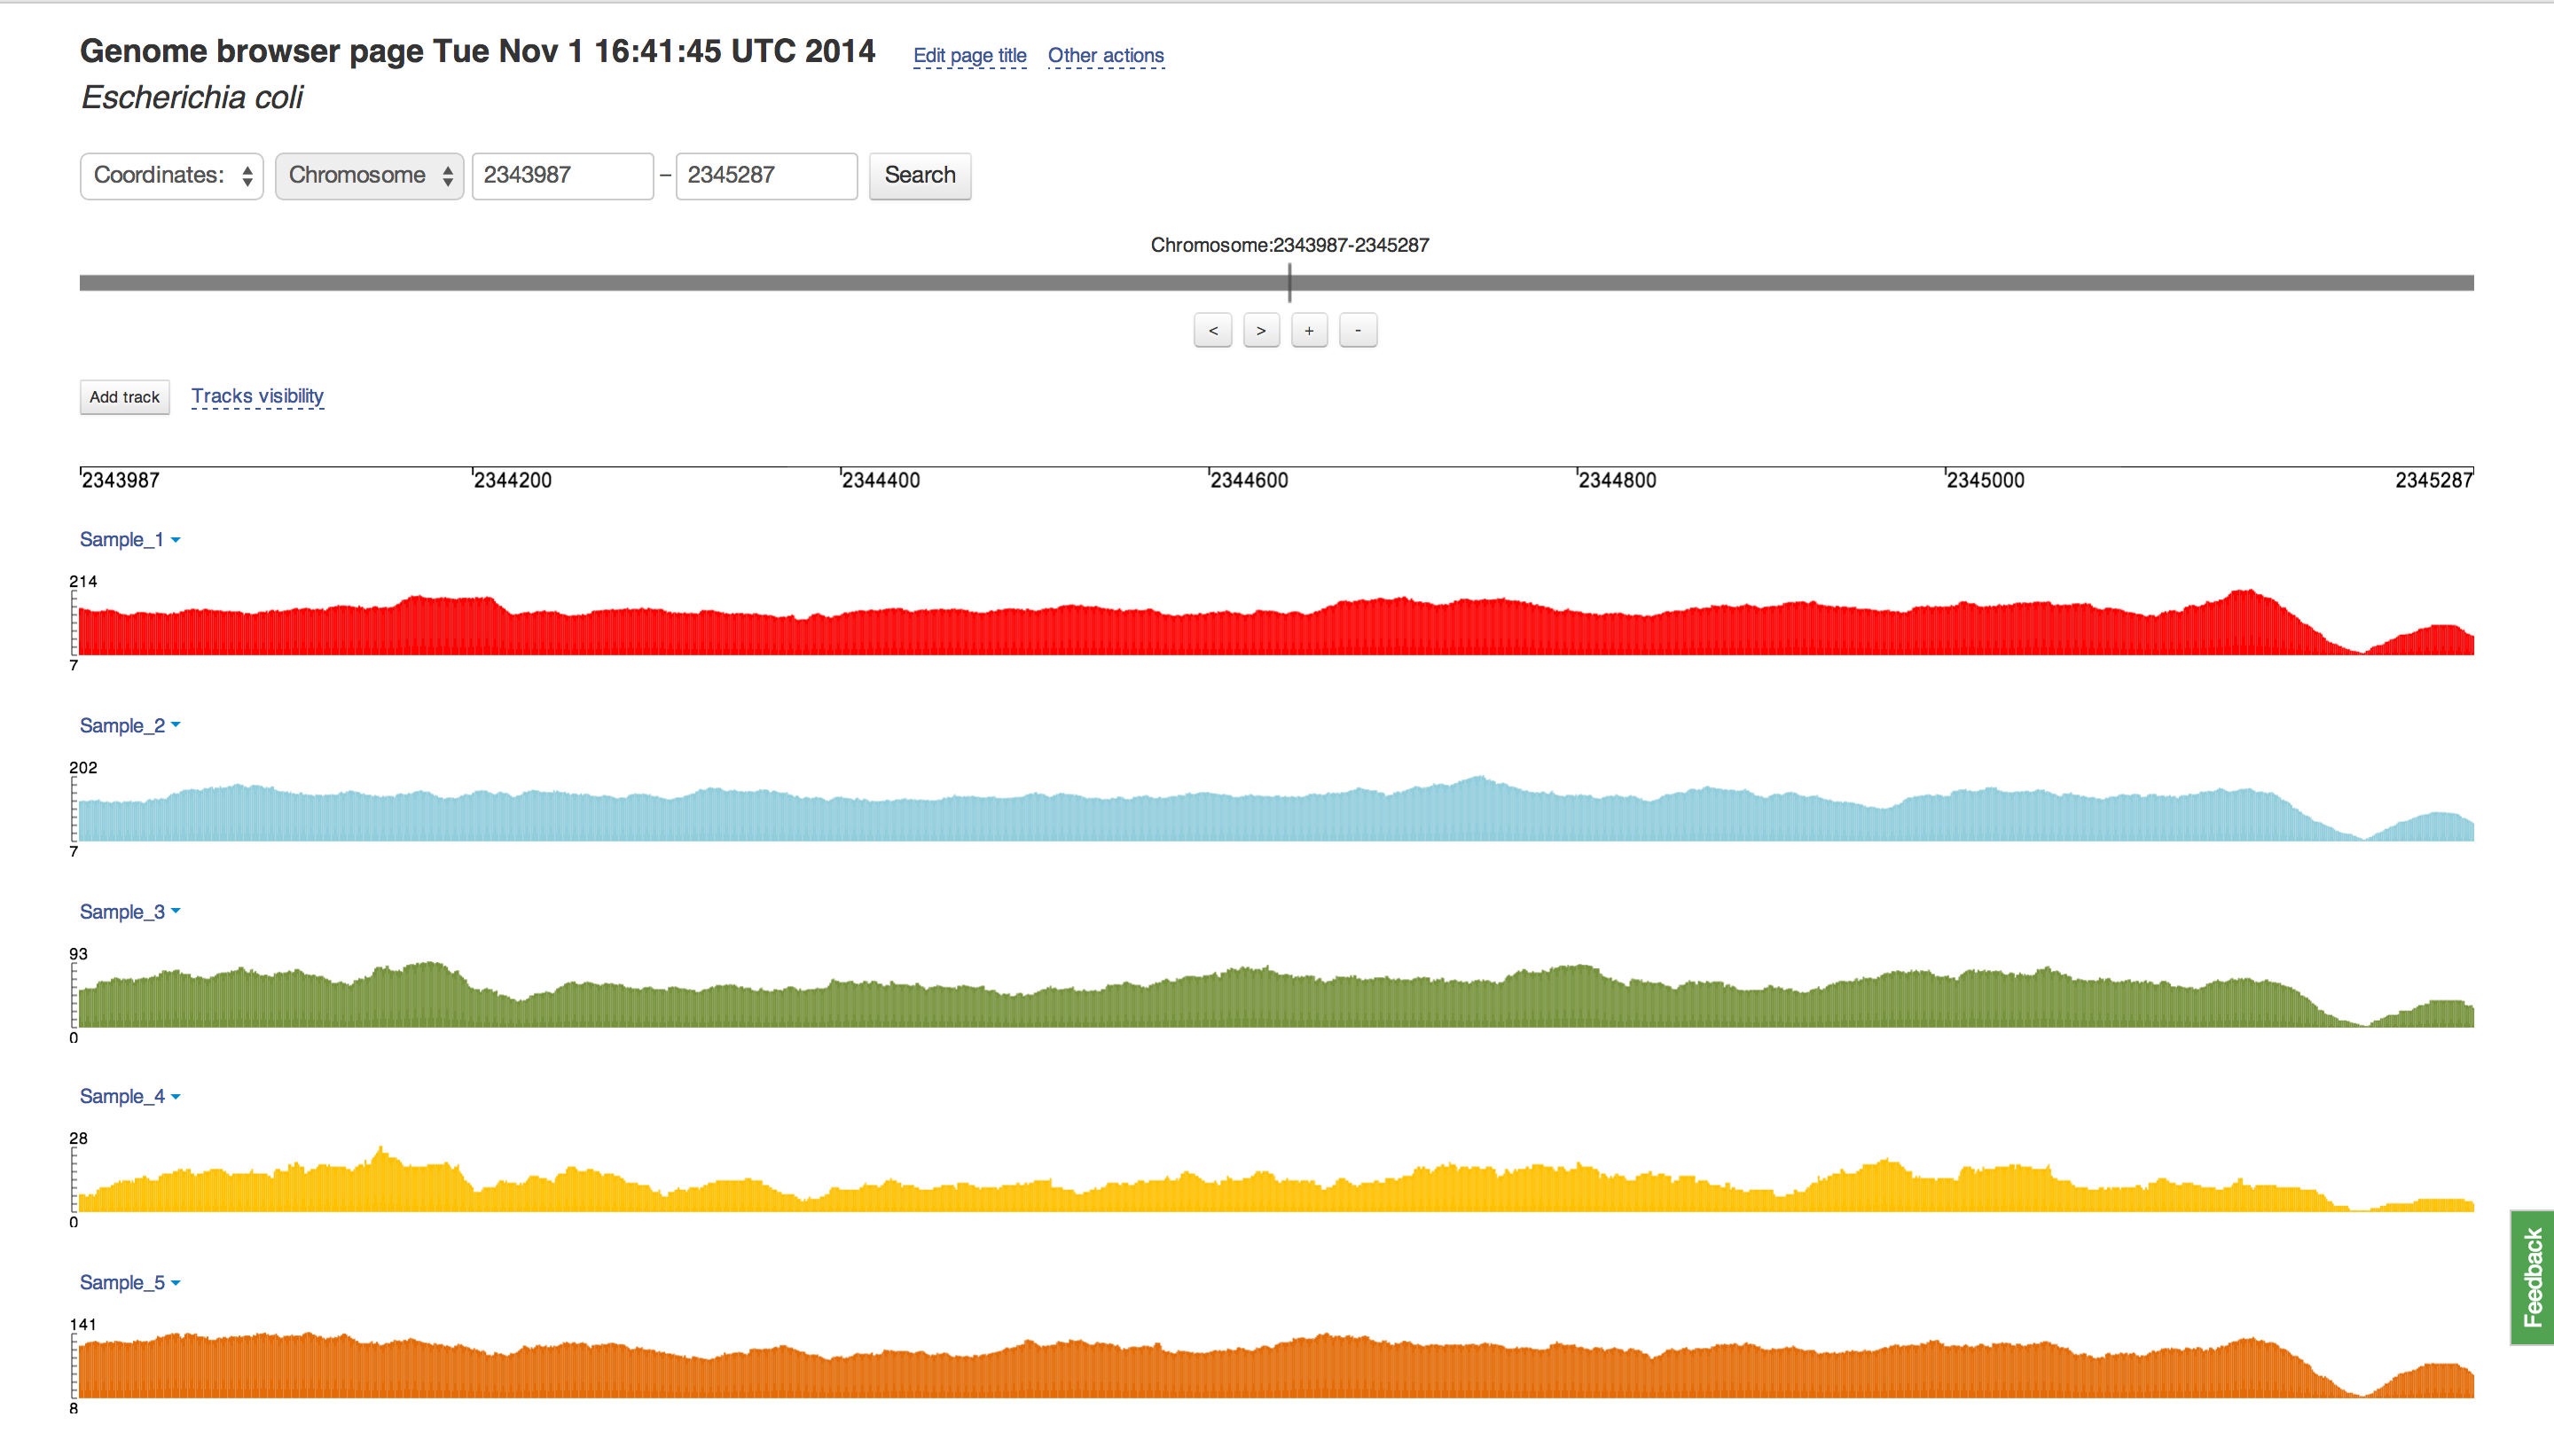 The Data range option lets you set maximum and minimum values to be shown. It can be useful when you are interested in a specific value range, say more than 100, or if you want to make data visually comparable between multiple tracks.
 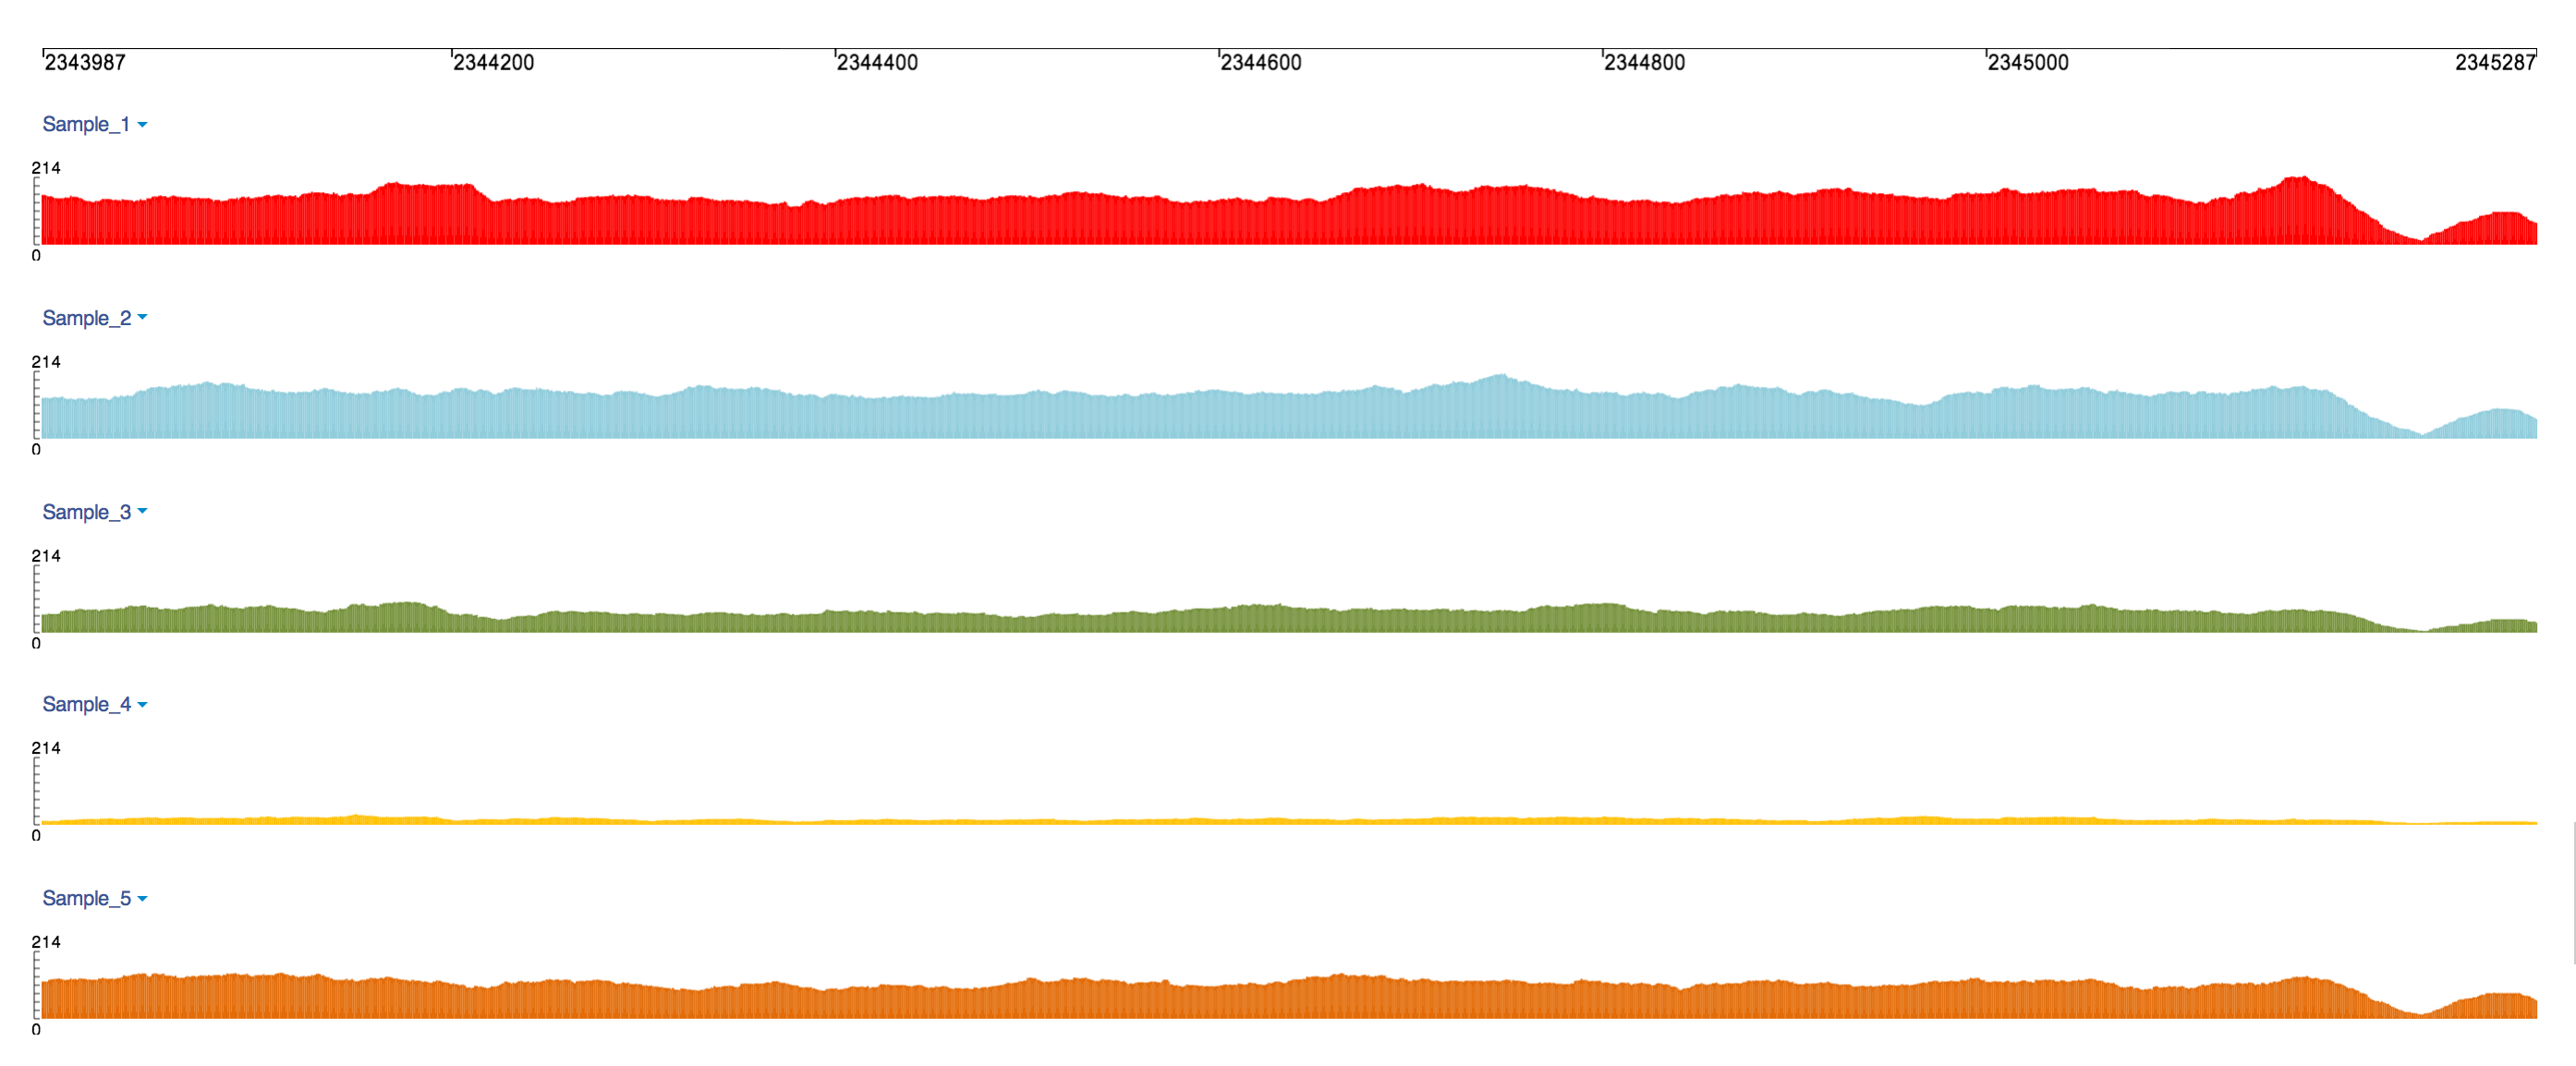 To make multiple tracks comparable, Track scale can also help. If you set the same scale, the tracks height is set depending on the data range.
Formula track
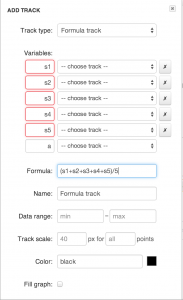
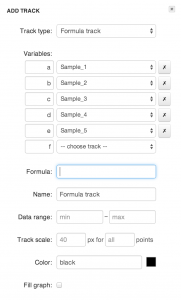 What if you are dealing with many tracks, and rather than viewing each track separately, you want to see the sum of all track values, or the average value of all tracks“ For this another type of graph track exists, called Formula track. In Track creation dialog you can write your own formula and assign tracks to variables. Basic mathematical operations and functions are supported, such as log, sin, and so forth.
 Just think of the possibilities. Just doing a log(a/b) to compute fold change is simple enough. You can write a quick t-test, just as well. What kind of custom functions would be useful to support in the formula track“ Sliding window functions“ Gene-wise functions“ Statistics“ Let us know!
 Combined track
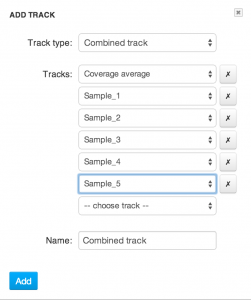 There is one more option for composing tracks: Combined track. With such a track, multiple tracks are overlaid and shown together! To create such a track, select Combined track in track creation dialog and set the source tracks. Formula track can also be used as a source track.
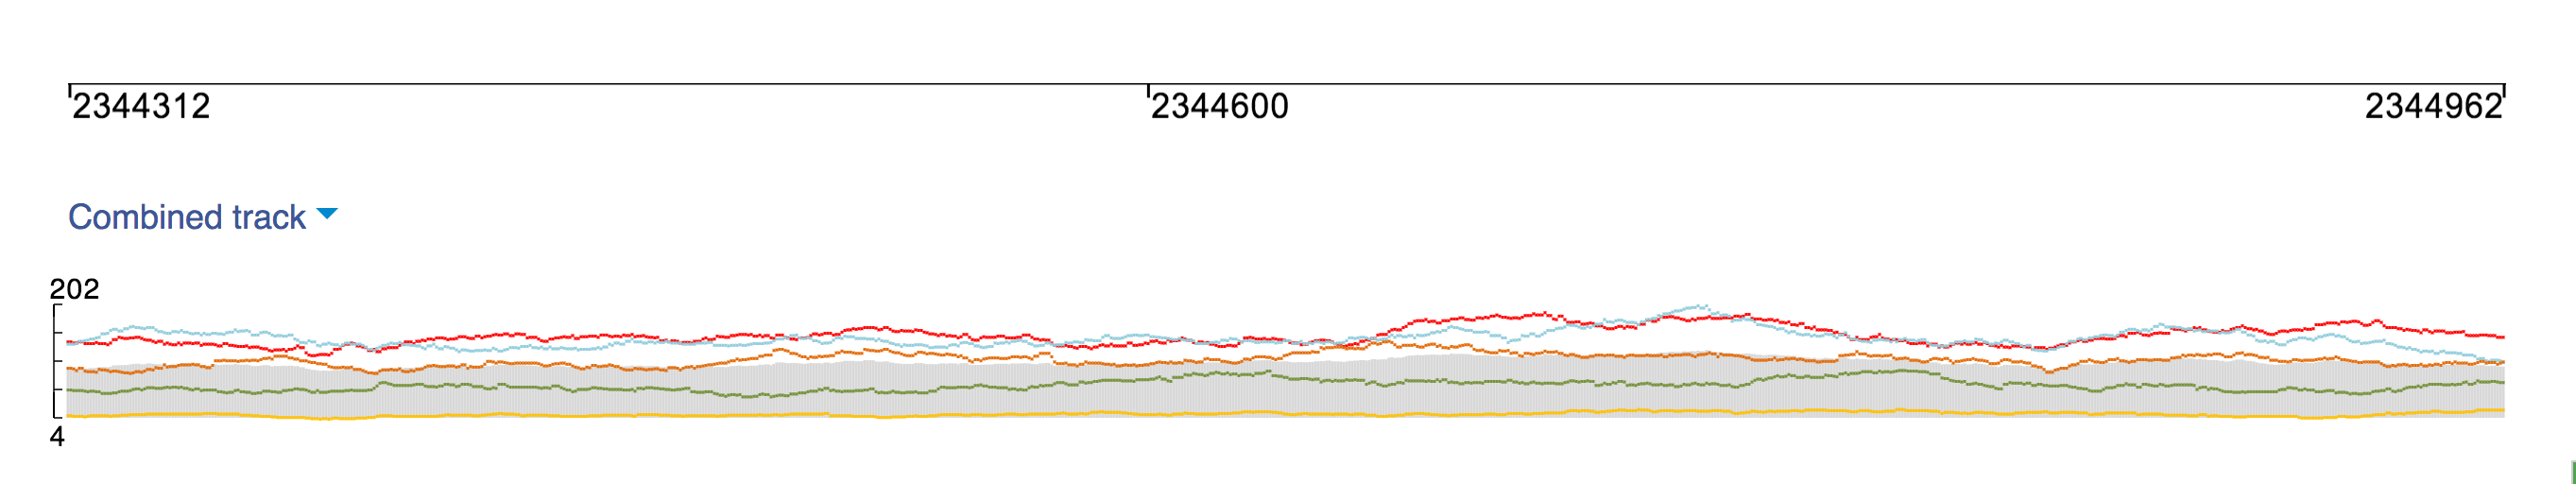
Further steps: complete your view
To complete your view you can hide the source tracks. This option is available in the individual track options dropdown, accessible by clicking on the track name, or in the Track visibility dialog, which you can open by clicking the link next to the Add track button..
Vertical rulers can be useful in multitrack view. Hover a mouse over horizontal scale, and click to place a ruler.
 Enjoy your custom view, share it with colleagues and don't forget to send us comments or suggestions using the Feedback button!