Publicly available genome-wide transcriptional expression data is lately gaining more and more popularity, as it can be used for drug repurposing or to infer adverse effects of previously unknown drug.
A first attempt to build a comprehensive collection of chemical compound "gene signatures" has been made in 2006 by the team in Broad Institute under the project name "Connectivity Map" (CMap). In total, this project measured gene expression profiles for 564 samples using microarrays, representing 453 distinct signatures (i.e. human cultured cells treated with various compounds at different concentrations and at different time points). The second release introduced more than 7,000 expression profiles from 1,309 compounds. The further expansion has led to the establishment of so-called Library of Integrated Cellular Signatures (LINCS) project, that include gene expression profiles for more than 10,000 compounds. The goal of these projects was to gain an insight into the mode of action of compounds at a transcriptomic and molecular levels.
The above-mentioned data is freely available online, so now we can integrate it within the Genestack environment. The Genestack platform is a perfect place for reproducing large projects: in this case, you could easily take advantage of already established and comprehensively used pipelines to reproduce existing results and build a collection of transcriptomic signatures within Genestack, which you could then query and compare to other results.
In this post, we will illustrate a re-analysis of differential gene expression for both the CMap and LINCS datasets performed on the Genestack platform, show the subsequent validation of the results and discuss the limitations of this approach.
1. Connectivity map data
Connectivity map dataset comes from Lamb, et al. 2006 and includes raw data files from Affymetrix microarrays. The data can be downloaded from the Broad official website (raw .CEL files and metadata). The experimental design of the CMap project is described in the file `cmap_instances_02.xls`.
On Genestack, the raw .CEL files have been uploaded to the experiment folder "Connectivity maps" together with their corresponding metadata. For microarray normalization and differential expression analysis, raw files were grouped by compound, cell line, and timepoint - in the CMap vocabulary, this is called a "signature". The normalization algorithm that we used on Genestack is Robust Multi-array Averaging (RMA) with quantile normalization to correct for array biases. Normalised files were saved in the folder "Normalised files for Connectivity Maps data" on Genestack.
Differential expression analysis was then performed on each group of normalised microarray assays using the "Expression Navigator for microarrays" application on Genestack, which uses the limma Bioconductor package. For each signature, differential expression statistics (normalized expression, log-fold change, p-value and FDR (false discovery rate)) were computed for each gene in the treatment group against the control group. As a result, 1,410 differential expression files were created for the CMap data in the folder "Differential Expression for Connectivity Maps data - final".
2. LINCS L1000 data
LINCS L1000 data is available on GEO under the accession number GSE70138. On Genestack, raw gene expression profiles have been uploaded to the experiment folder "LINCS Experiments", consisting of 11,5209 GEX files in 12 subfolders. For microarray normalization, raw files were grouped by cell line, compound, plate number and time point (comprising a signature), meaning that replicates from different 384-well plates were normalised separately. Normalised files were placed in the folder "Normalised files for L1000 data" on Genestack.
Differential expression analysis was then performed on the normalised data, comparing the gene expression levels for each dose vs control group (DMSO under the same conditions). For each group, differential expression statistics (normalized count, log-fold change, P Value and FDR) are computed for each gene in the group against the control group. As a result, 5,332 differential expression statistics files were created and saved in the folder "Differential Expression For L1000".
3. Validation of the results
Having done the differential expression analysis and identified genes whose expressions differ under different experimental conditions, we wanted to see how well our analysis pipeline performed. The validation is a bit tricky as the problem here is that both CMap and LINCS L1000 did not perform differential expression analysis but instead used ranked raw gene expression data (with only microarray normalization step applied) and later on, utilized their in-house developed metrics to find the compounds that are similar to the gene expression profile of interest - they called it the connectivity score.
In order to validate the results of differential expression analysis for CMap data, we have used the same connectivity score metric, developed by CMap and described in [1]. Briefly, given a query signature, connectivity scores are calculated based on Kolmogorov-Smirnov statistics against all reference signatures, normalized to the maximum score for up-regulated (or minimum for down-regulated) signatures so that they ranges from +1 to -1. Connectivity score of 1 means a perfect correlation of reference signature with query signature (i.e. top-regulated list of genes, ranked by their expression, appear in the same order) and connectivity score of -1 means strong anticorrelation between signatures (order of genes is reversed, i.e. down-regulated genes occur instead of up-regulated genes).
3.1. CMap validation
The CMap team has provided reference gene expression data in the form of a ranking matrix. In this matrix, each column corresponds to the individual compound perturbation and contains probe IDs as row names and the corresponding list of ranks. Ranks are ordered from 1 to N (where N is the number of probe sets on the arrays, in this case, 22,283) so that the most up-regulated genes will have rank 1 and the most down-regulated genes will have rank N. So, our goal is to calculate connectivity score for 500 top up- and down-expressed genes from Genestack (500 is the maximum number of genes recommended by CMap team) using CMap ranking matrix as reference database.
As a result, the connectivity scores were calculated for each of 1,410 signatures from Genestack and 3,591 reference signatures from the CMap ranking matrix. We had fewer signatures on Genestack as we performed compound grouping for normalization step with at least 2 samples per group and didn't process groups without control samples.
We then identified the signature from CMap with the highest score for each given signature from Genestack, and for 1,379 query signatures out of 1,410, the highest connectivity score was assigned to the correct reference signature (same cell line, compound, and dose); meaning that the overall precision of differential expression reanalysis was 97.80 %.
3.2 LINCS validation
The data provided by the LINCS team is in the form of a Z-scores matrix (from the "Level4" file available on GEO).
Due to the computational complexity of connectivity score metrics calculation, it was estimated that for LINCS L1000 data, these calculations would be intractable as there were 5,332 signatures, each contains on average 6 distinct doses. We have, however, performed initial assessment and calculated connectivity scores for 100 random signatures and 93,664 reference signatures from LINCS z-score matrix. Consistent with our previous finding, for 96 query signatures out of 100, the highest connectivity score was assigned to the reference signature corresponding to the same signature (cell line, compound, plate number and time point); meaning that the overall accuracy of the differential expression analysis was 96 %.
However, the computation of above mentioned matrix of connectivity scores for 100 signatures on a standard laptop took around 3 hours. To overcome the time complexity, we have taken different approach and developed a different metric (credit goes to Ben Eills from the bioinformatics development team at Genestack) to assess how many of the probe IDs are clustered at either the top or the bottom of the ranked probe list, we called it B-score. This metric is essentially similar to connectivity score, but unlike connectivity score, where it has to be calculated against all reference signatures in order to obtain a baseline value and cannot be reliably interpreted in case of single comparison (query vs reference signature), B-score is suitable for 1-to-1 comparisons (i.e. top-regulated genes as identified with Genestack platform vs. top-regulated genes from published LINCS results).
In brief, B-score ranges from 0 to 1, where B-score of 1 means that all of the top up- and down- regulated genes in the query signature occur in the same order as in reference signature (i.e. perfectly correlated). B-score of 0.5 means that top-regulated genes from Genestack occur randomly within the list of genes from reference signature and B-score of 0 means perfect anti-correlation between query and reference signatures (genes occur in reverse order). The technical details are available upon request.
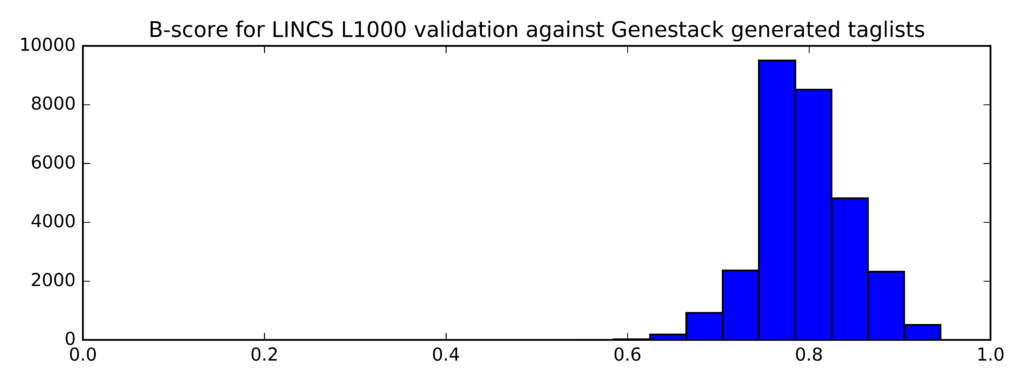
To validate the results of differential expression analysis for LINCS L1000 data, B-scores were calculated for each of the 29,148 signatures from Genestack (separately for each dose of 5,335 signatures), against the corresponding reference signature from the LINCS Z-score matrix.
The distribution of B-scores is given below:
Min Average Max
0.545 0.795 0.945
In comparison, this is the distribution of B-scores for randomly generated lists of probe IDs (instead of taglists):
Min Average Max
0.479 0.5 0.525
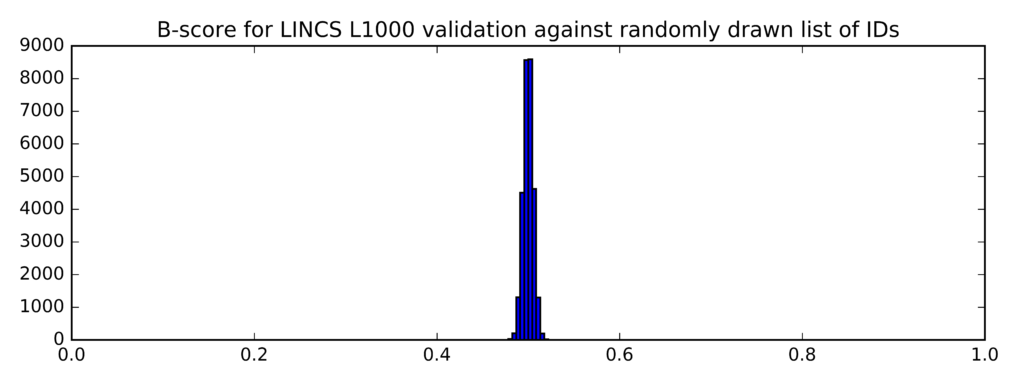
The clear difference (confirmed by a t-test) between the two distributions of B-scores demonstrates that the mean B-scores for top differentially expressed genes identified on the Genestack platform are significantly higher that the mean B-scores for randomly generated list of genes.
We have repeated the B-score calculations on the CMap data and got the similar distribution, showing the good amount of consistency (in line with validation using the connectivity score metric). This way of validating the results is, of course, not straightforward and quite difficult to compare meaningfully with the published results of CMap and LINCS due to several reasons:
We are using essentially different pipelines: on Genestack we have performed normalization and differential expression analysis while CMap used raw data and reported the ranking of signatures according to raw gene expression. The LINCS team has likewise performed different normalisation and analysis and produces z-scores for each gene. Yet we still got quite accurate and consistent validation results.
Unlike connectivity score which is calculated for all reference signatures, B-scores are calculated on 1-on-1 basis for each signature from Genestack against corresponding signature from CMap or LINCS L1000. Yet B-score distribution still show quite high correlation of given signature with reference signature (confirmed by calculating connectivity score for 100 signatures).
4. Conclusion
We have performed differential gene expression analysis and produced a comprehensive collection of top-regulated genes for CMap and LINCS L1000 published data. Interestingly, despite of the differences in pipeline used, we have found that our results correspond to the published results (both CMap and LINCS) with a high degree of accuracy, namely 96%. One of the next possible steps could be to upload your own experiment's result to Genestack and search for compounds that have similar transcriptomic response (utilizing processed results of CMap and LINCS L1000 data as reference database) using the newly built differential meta-analysis application on Genestack (development in progress and will be released soon, keep an eye for our future blog posts).
The more detailed report and analysis code are available on request.
[1] Lamb, J., Crawford, E. D., Peck, D., Modell, J. W., Blat, I. C., Wrobel, M. J., ½ Golub, T. R. (2006). The Connectivity Map: Using Gene-Expression Signatures to Connect Small Molecules, Genes, and Disease. Science, 313(5795).