There are many different tools and methods for visualising the structure of high-dimensional single-cell RNA-seq data as well as for identifying subpopulations of cells. Most of these methods focus on keeping dissimilar samples far away from each other. However, since RNA-seq data often presents strong variability in expression profiles from one cell to another (especially due to technical noise), it is often more important to focus on local similarities between different samples.
Today we'd like to introduce a new method to visualise and cluster cells with similar gene expression. It is based on an algorithm called t-distributed Stochastic Neighbour Embedding (t-SNE), which is used as an alternative to Principal Component Analysis (PCA). In many cases, it does a better job than PCA at segregating clusters of samples with similar gene expression patterns in the presence of technical noise. This new method is a part of Genestack's Single-Cell Transcriptomic Analysis pipeline that will be presented in this post.
The experiment
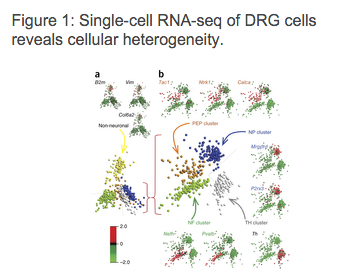
In order to demonstrate the new method for visualising and clustering cells and the single-cell RNA-seq analysis data flow, we will use data from a 2015 publication by Usoskin et al. on classification of sensory neuron types. The authors' goal was to use comprehensive transcriptome analysis of over 600 single mouse neurons to classify them in an unbiased way into sensory subtypes. In order to do that, they performed single-cell RNA-Seq, mapped the raw RNA-Seq reads to distinct genes in each cell and finally performed PCA of expression magnitudes across all cells and genes that revealed five distinct main clusters.
[caption id="attachment_4051" align="alignnone" width="339"] Usoskin, D. et al. Unbiased classification of sensory neuron types by large-scale single-cell RNA sequencing. Nature, 2015.[/caption]
 Later, in order to discover further subtypes of neurons, PCA was performed on each of the five main clusters using only the genes that were differentially expressed when compared to another cluster. This resulted in discovering 11 different neuronal subtypes, which, as authors concluded, is consistent with the known developmental origin of sensory neuron types.
The pipeline
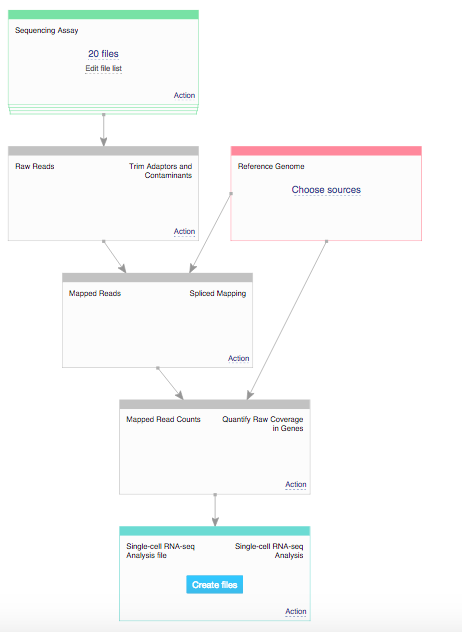
We reproduced the analysis using the applications available on Genestack platform. In order to do that we used one of the publicly available data flows called Single-Cell Transcriptomic Analysis. The first step of the analysis was checking the quality control of raw RNA-sequencing reads. This was performed using FastQC application. Reports generated by this app pointed out the fact that the reads still contain barcodes, so in the next step of the analysis we performed raw reads preprocessing and removed the barcodes using the Trim Reads app. Following this we aligned the reads to the reference genome using the Spliced Mapping app and quantified gene counts using Quantify Raw Coverage in Genes app. Finally, we performed single-cell analysis using Single-Cell Analyser and Visualiser and explored differences between clusters using our interactive Expression Navigator app.
Single-Cell Analyser and Visualiser apps
During the analysis performed on the Genestack platform, we used a new, previously mentioned method of visualisation of cells based on an algorithm called t-distributed Stochastic Neighbour Embedding (t-SNE). Genestack's Single Cell Analyser and Visualiser have one more important feature-an improved effective way of automating cluster identification. Previously, automatic cluster identification was done in the visualiser by cutting the heatmap dendrogram at a fixed number of nodes. Using our new method, it is possible to divide cells into clusters using a well-known k-means algorithm. This time each cell will be assigned to a parental cluster based on its gene expression profile. Moreover, the algorithm allows you to determine the optimal cluster number using the "elbow method".
By combining t-SNE algorithm with the k-means clustering algorithm we can easily perform both: sample visualisation and automated cell classification into cell subpopulations:
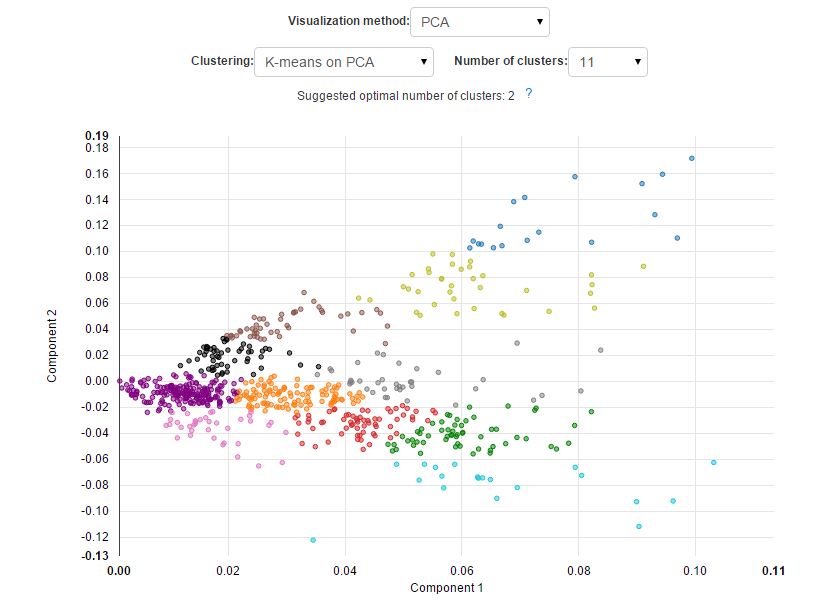
The new approach results in a better separation of known cell types and is able to reveal cell subpopulations that could not be identified using standard PCA. Here is what it would look like if the visualisation was performed using PCA:
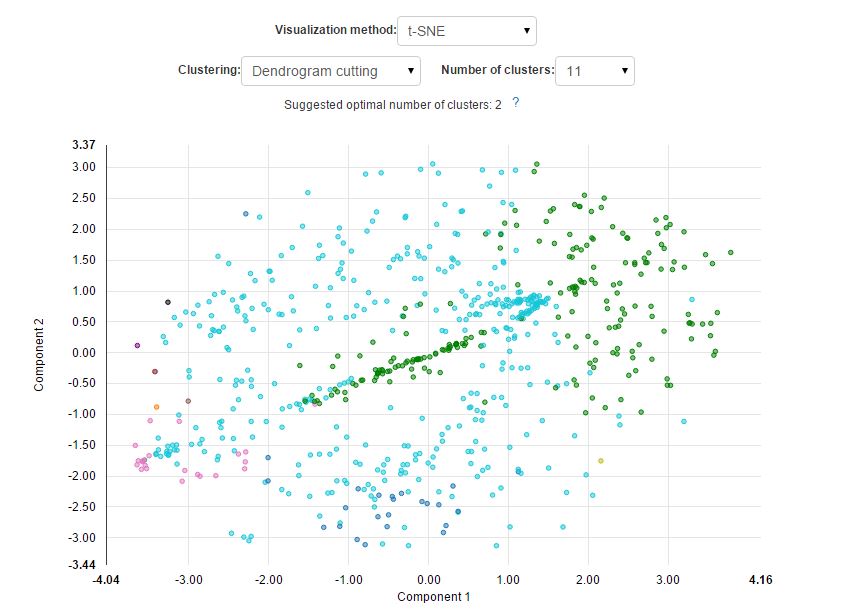
And here is what it would look like if we used dendrogram cutting instead of the k-means algorithm:
All visualisations and clustering features can be tested interactively on our platform using a set of dropdown menus located above the plot. This way you can easily try out and compare different visualisation strategies to find the one that is the most suitable for your data. We'd like to encourage you to reproduce this analysis yourself. This experimental data, along with hundreds of thousands of other experiments can be found on Genestack platform in the Public Experiments collection. A range of various data flows (including Single-Cell Transcriptomic Analysis data flow used here) is also publicly available on the platform. You can read more about data flow in our "Getting started" tutorial. To read more about single-cell analysis go to one of our tutorials. Find all of the computated files mentioned in this post here.
Click here to start the data flow run yourself!
We hope that you'll like this new visualization and clustering method. Please take a moment to share your comments and thoughts with us. If you have any problems, suggestions or questions, drop us a line at support@genestack.com.
Genestack team


