
Introduction
We humans like to grow our food, and it’s only natural to find yourself tailoring a crop tailored to the preferences and demands of a population centre. These crops become not only a food source for large swathes of populations, but also become an investment - and protection of such an investment is vital. Therefore, the control of insect pests - one of the greatest threats to crops - is one of the greatest challenges of agricultural science.
Let’s now quickly introduce the Spodoptera. Species of this genus are found in many regions of the northern and southern hemispheres. They are commonly known as armyworms and damage many crops and vegetables. They are a critical risk to the investment being put into many crops.
In this study, we wanted to find out which active ingredients and infections are the most effective in eliminating the Armyworms threat capability to crops. We focused on the 3 most studied species of this genus.
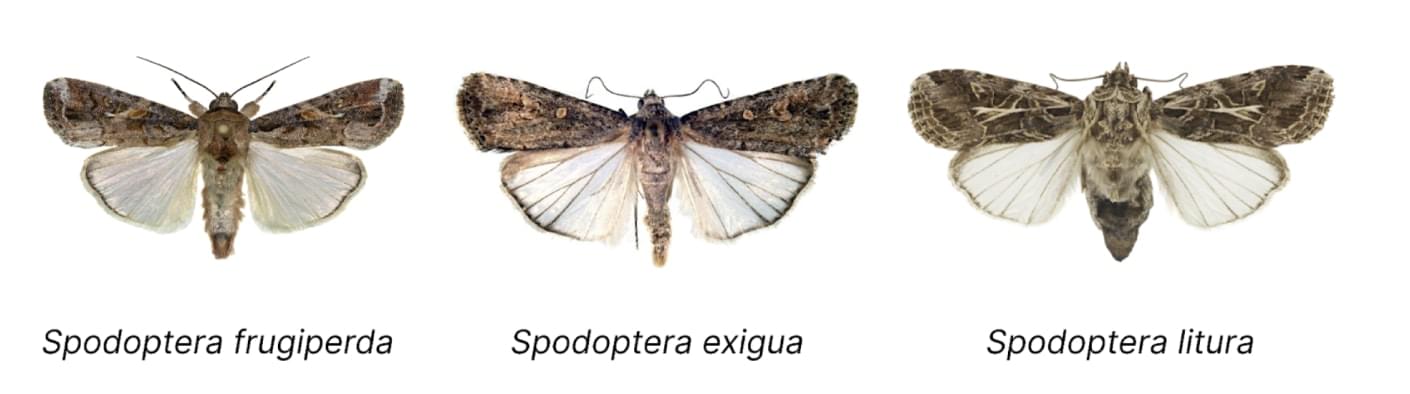 Spodoptera species, analysed in this research
- Spodoptera frugiperda1 - damages 80 different plant types, yet mainly grasses. The larvae eat the leaves, leaving only the ribs and stems of maize plants. They also bore into the buds and destroy the growth potential of a single plant.
- Spodoptera exigua2 is a pest of vegetables and crops, including soybeans, maize, cotton and tobacco. The larvae bore holes in the leaves and eat the stem, causing great damage to the plant.
- Spodoptera litura3 - harbours more than 120 plant species, including cotton, corn, rice, soybeans, tea, tobacco and vegetables. Is also known as the tobacco caterpillar and is widespread throughout tropical and temperate Asia, Australasia and the Pacific Islands.
Challenges
We’ll be virtually testing data for various pesticides for this study.
When trying to analyse expression levels on different species using different toxins in pesticides - it can be a challenge to organise this data, and in several ways. In this section we run through several potential issues that a data scientist or researcher might encounter during this investigation, and how Genestack’s ODM can alleviate such hills.
Selecting relevant expression values based on metadata.
To compare the expression levels of different species under different compounds, we have to select the expression levels based on the metadata of the samples. Normally, the samples are given in GEO as a series matrix file, which cannot be used to select values from the expression matrix. So we loaded all the data onto our platform and cleaned it. After that, we could ask complex queries like "Give me all expression values for Spodoptera frugiperda cells treated with Cry1C toxin and Spodoptera exigua cells treated with Bacillus thuringiensis VIP3A toxin" - allowing us to view it instantly, and without complexity.
Loading and cleaning data efficiently.
A data scientist spends 80% of his time cleaning data. It is boring, monotonous and no one is excited about getting around to it. So our goal as a company is to ensure a team spends no more than 10% of their time doing it. The good news is that the Genestack platform has an API, which means you can programmatically load, select and analyse your data and automate your tasks. In this research, we used the Python script from the script library to download the data from GEO, load it into ODM and then clean each study using the same set of rules. We love that these scripts are easy to create and customisable to your own needs. It also saves a lot of time as you do not have to clean up each dataset individually.
Working with many datasets as one.
For this analysis, we had to work with six different datasets so that we could combine them and compare different treatments for different species. As these datasets came from public sources and from different authors, this was not an easy task. By uploading them all to the Genestack platform, it became much easier. First, it gives us the option to treat all six studies as one - thanks to a cross-study search. Secondly, thanks to the data templates, we are able to unify all datasets under the same data model in just moments. Finally, we also unified the terms used in the different datasets. This was done using the platform's dictionary feature, which allows you to load scientific ontologies and controlled vocabularies to curate your terms and unify them across different studies. No more "S. frugiperda" in one study and "Spodoptera frugiperda" in another.
Materials and methods
We’ve assessed the challenges ahead, and how Genestack’s ODM can help overcome those challenges. As we’re running this study from GEO, we now have to reflect on where our materials were actually sourced from, and what methods we used in this section.
Loading and cleaning data
GEO4 is a diverse source of public datasets on expression data. We took six datasets with the following accessions: GSE51195, GSE60739, GSE68037, GSE32336, GSE30937, GSE32337. The series matrix files were a perfect source for both sample metadata and expression values. We loaded all six studies into one of our ODM instances to further access the data via an API.
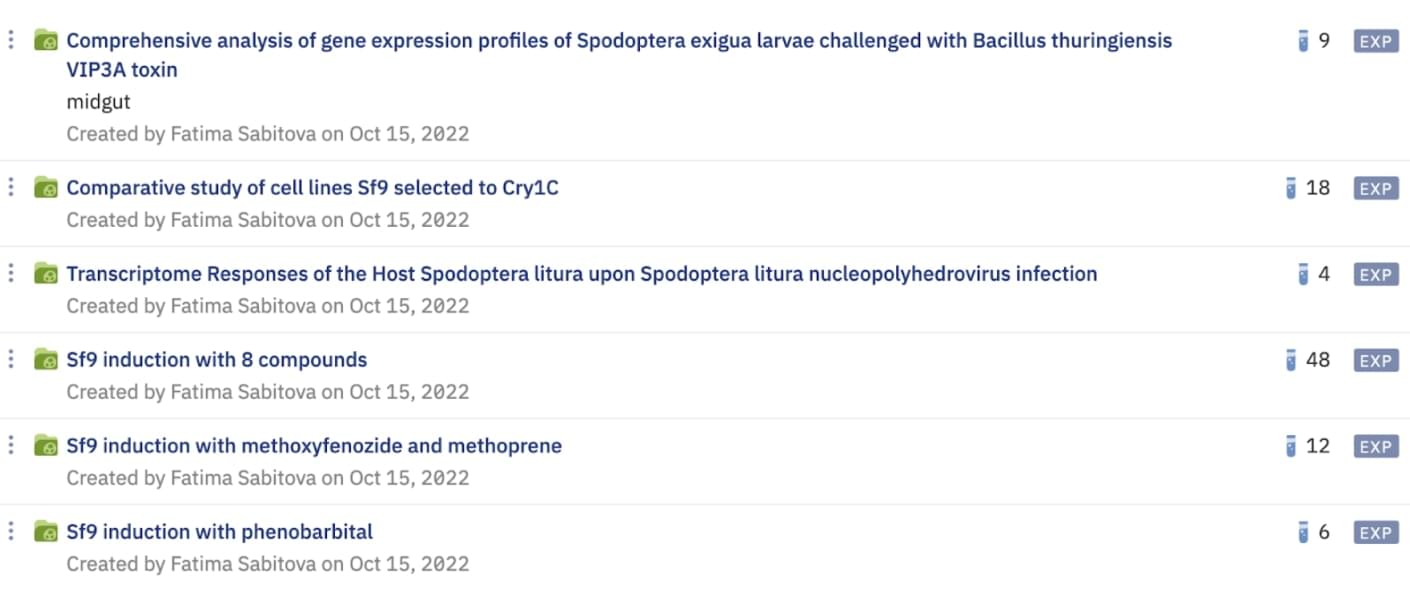 The list of datasets loaded to the Genestack platform from GEO
The next step required a bit of tidying up. This already sounds tedious and annoying, but thanks to the APIs of the Genestack platform, monotonous tasks like this can be automated with a single script. Since all six datasets came from the same source and had a similar structure, we decided to run a curation script that cleans up the data. It took the .json file as input and applies the rules to each record you need.
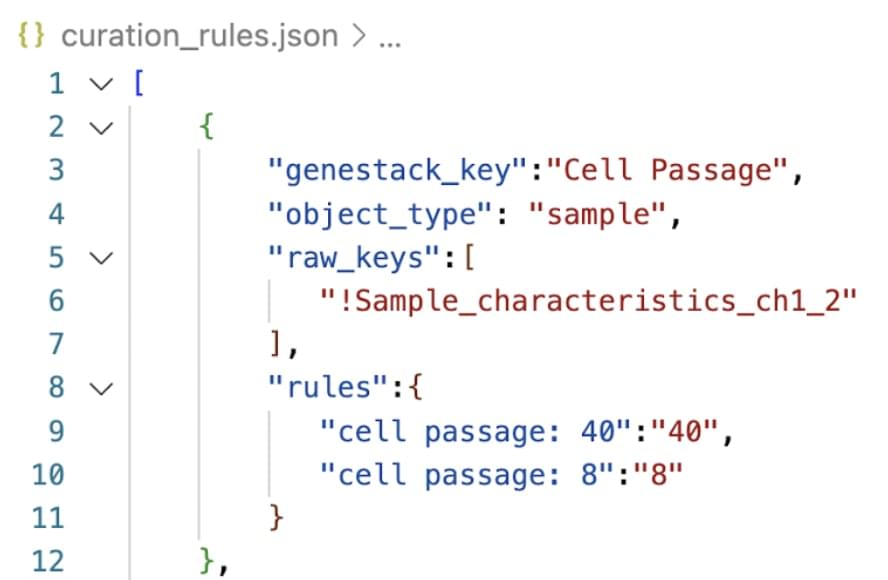 An part of an example .json file to clean the data programmatically
There were several data fields that were particularly important for our research - 'organism' (different species of Spodoptera), 'cell line' and 'treatment'. So we wanted to be sure that 1) our data contained these fields and 2) the values were harmonised across all datasets. If Spodoptera frugiperda is listed under "species" in one record and "organism" in another, we can never rely on our queries and have to do a lot of manual work. Harmonising all your data is the key to efficient automation therefore.
The template is the first thing we created on our platform because it allows you to create as many templates as you need so you can harmonise different types of datasets in the most efficient way. We have added scientific ontologies to several fields - such as the NCBI taxonomy for the 'organism' field and the unit ontology for the 'treatment dose' field.
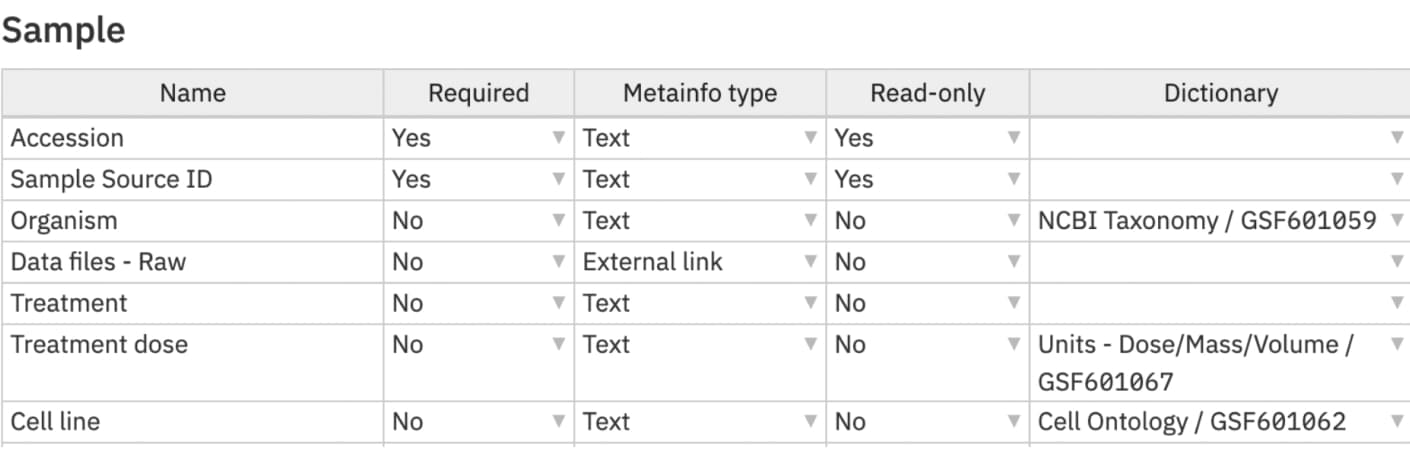 A part of the template used for samples metadata with the name of a field, if it is required or not, type of metadata, if it is read only or editable and a scientific ontology attached to the field.
Finally, the data was cleaned and ready for analysis. The best part is that it took us no more than an hour to load and clean six datasets.
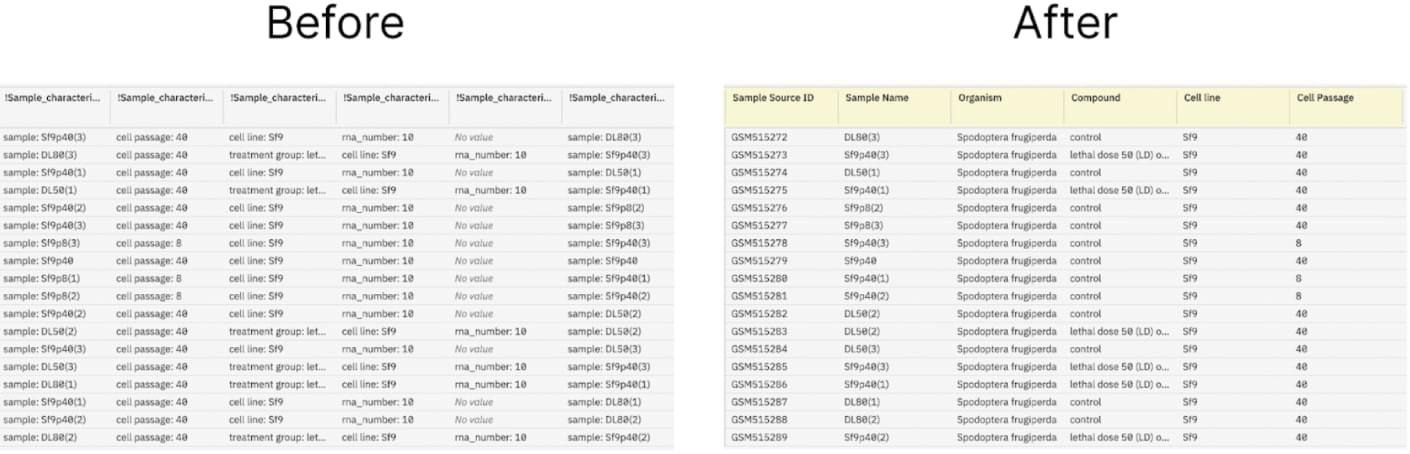 Sample metadata before and after curation
Analysis of the data
The aim of the study was to compare the expression levels of three Spodoptera species under different conditions involving pesticide toxins. We used a combination of R and Python to achieve this, which Genestack has libraries for both - so it is extremely easy to get the data from ODM without having to use the API directly.
To create a list of differentially expressed genes, we used the limma5 package for R. The ggplot26 library was our choice for creating plots and the bio.Blast7 package for Python was used to get the gene annotations.
We create a list of differentially expressed genes for each condition and select samples with the p-value below 0.05. Then we determine which genes behave similarly under different conditions to draw a conclusion.
Results
We have now used the Genestack ODM in two effective ways; to firstly break down the challenges of modern data analysis and secondly via implementing them into the methodology of our study - the ODM has allowed us to break down the study and now generate what we are all looking for - the results, and hence the insights, in less than one hour from nothing to result ready-to-use data.
These results have been broken down by species, comparing their different expressions separately to analyse any congruent or relevant information that may generate new insights into this critical threat upon crops.
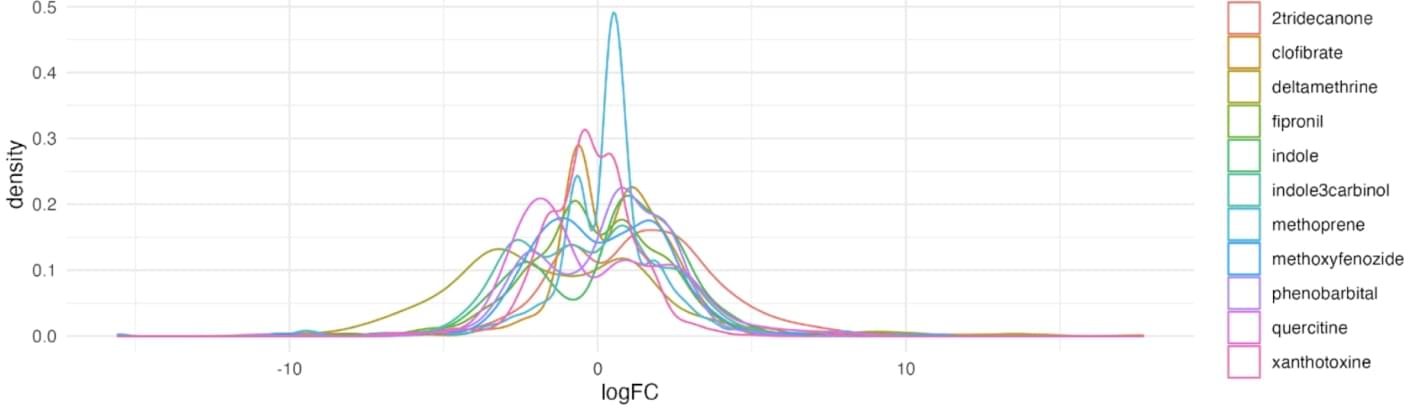 A density plot summarising the distribution of logFC in S. frugiperda cells treated with 11 different compounds and p-value < 0.05
Firstly, we examine the cells of Spodoptera frugiperda treated with eleven different compounds: Xanthotoxin, Fipronil, Clofibrate, 2 Tridecanone, Indol3carbinol, Indole, Quercetin, Deltamethrin, Methoxyfenozide, Methoprene, Phenobarbital. Of all, clofibrate showed the most active response with 877 differentially expressed genes (516 upregulated and 361 downregulated). Deltamethrin showed the weakest response with only 350 differentially expressed genes (239 upregulated and 111 downregulated).
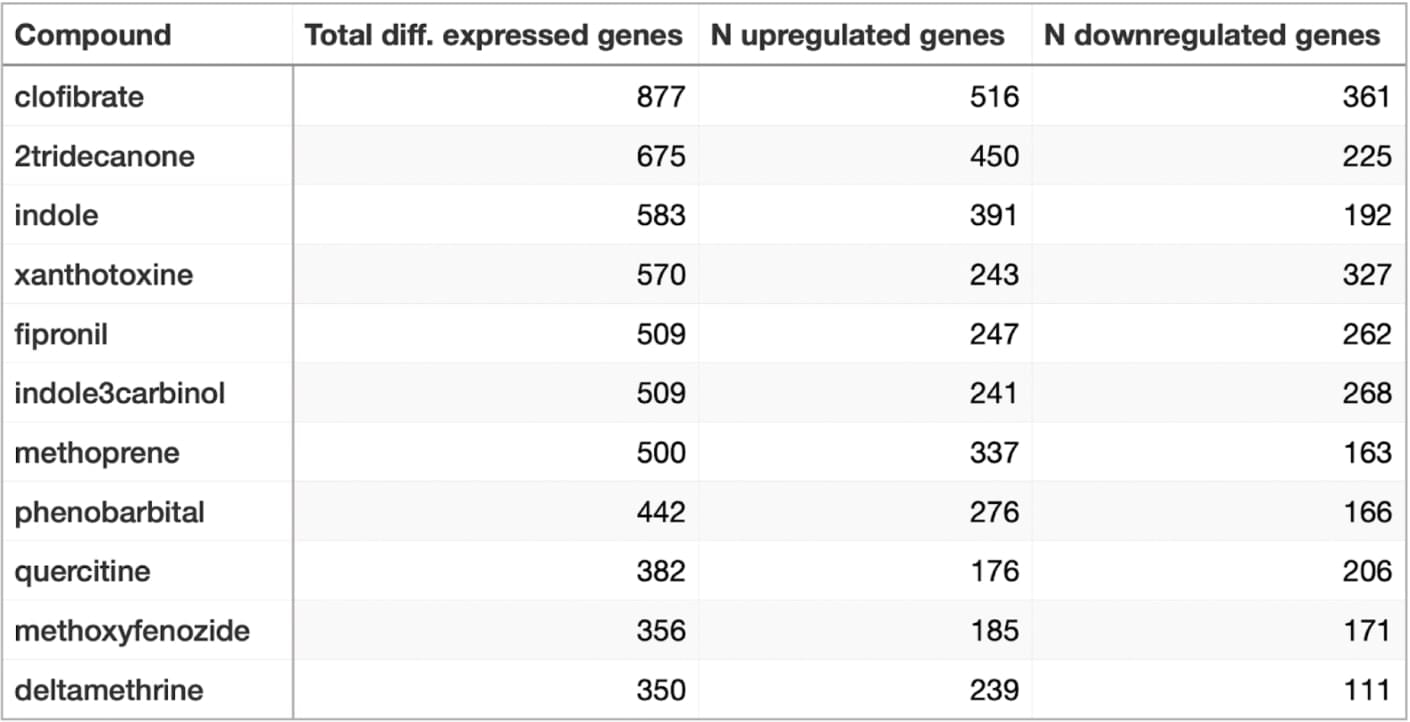 A table summarising the number of up- and downregulated genes in 11 compounds, sorted descending
The general trend is that the treatments cause more genes to activate their expression than to be repressed.
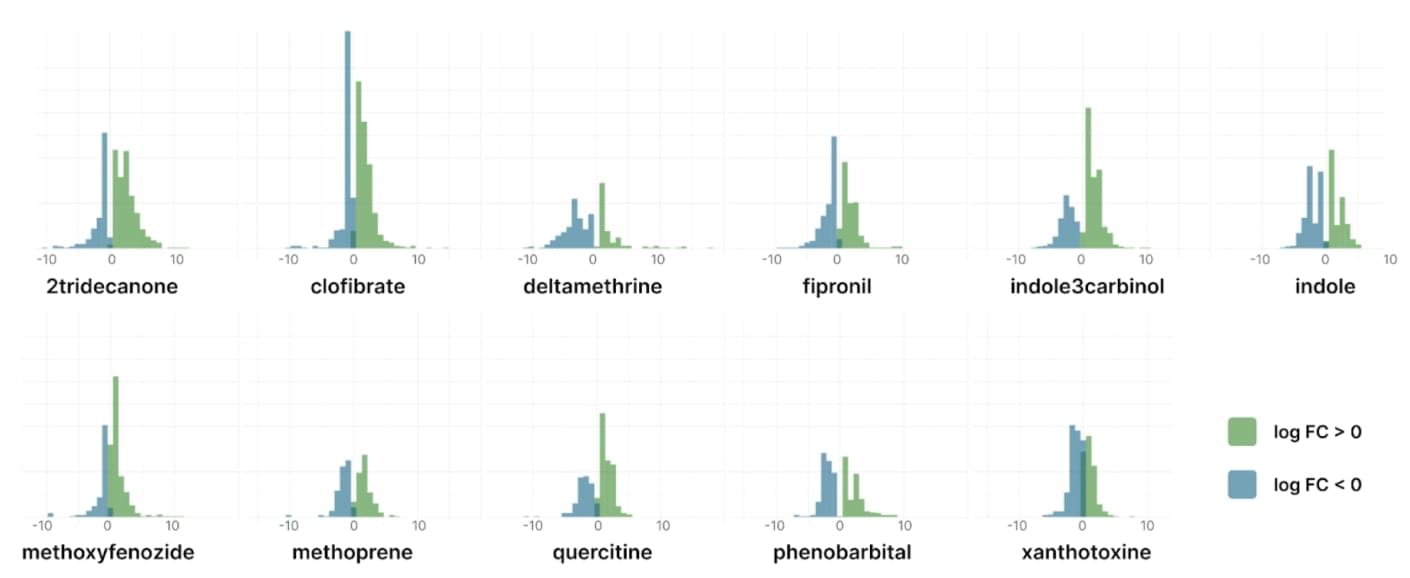 Histograms summarising the distribution of logFC in S. frugiperda cells treated with 11 different compounds and p-value < 0.05
The expression profiles were unique for each compound, but there were some common differentially expressed genes across multiple compounds. For example, the gene encoding the beta-chain of tubulin was down-regulated in 5 of 11 compounds and up-regulated only in deltamethrin-treated cells. In contrast, the sentrin-specific protease showed increased expression in 4 different compounds.
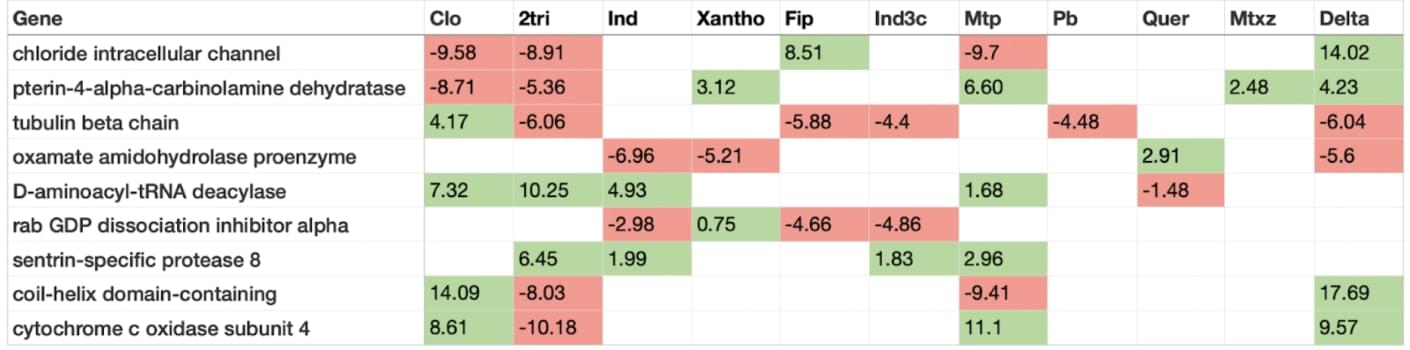 A table summarising the number of up- and downregulated genes in 11 compounds, sorted descending. Green - upregulated, red - downregulated.
Spodoptera frugiperda infected by nucleopolyhedrovirus
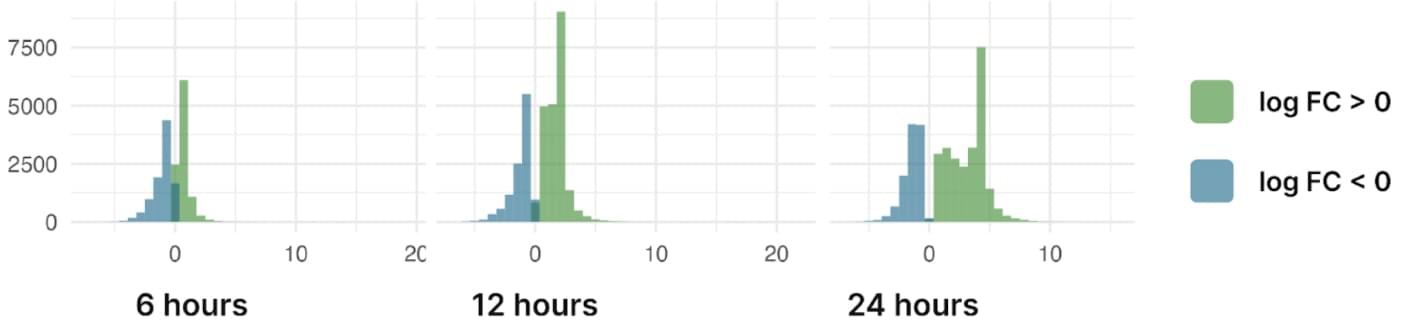 Histograms summarising the distribution of logFC in S. frugiperda infected by nucleopolyhedrovirus and p-value < 0.05
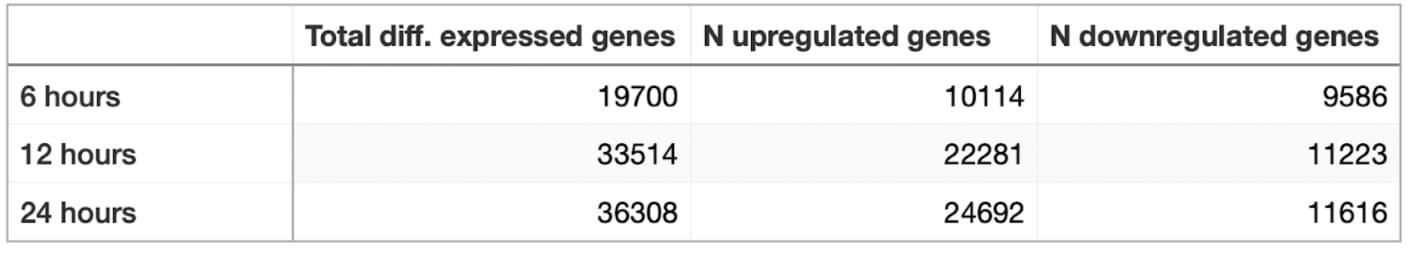 Table showing the number of up- and downregulated genes in S. frugiperda cells infected by nucleopolyhedrovirus after 6, 12, and 24 hours
When treated with nucleopolyhedrovirus, Spodoptera frugiperda cells show an active expression response. More than 36k genes change their expression after one day of treatment. Most of them are upregulated. Genes that are upregulated within 24 hours include chitin deacetylases, phosphatidylethanolamine-binding protein, angiotensin, integrin and a pG1 protein gene.
Highly downregulated genes include collagen alpha-1, zinc-iron transporter, fructose-1,6-bisphosphate aldolase, fibrillin-like protein, prophenoloxidase activating enzyme. Cytochrome b genes are also strongly upregulated, while cytochrome c genes are mostly downregulated.
Interestingly, angiotensin-converting enzymes are activated after 6 hours but repressed after 24 hours, although it is currently unclear whether they play an immune function against viral infection8. The same is true for a phosphatidylethanolamine-binding protein that is known to play antimicrobial functions in pests9.
Spodoptera litura infected by nucleopolyhedrovirus
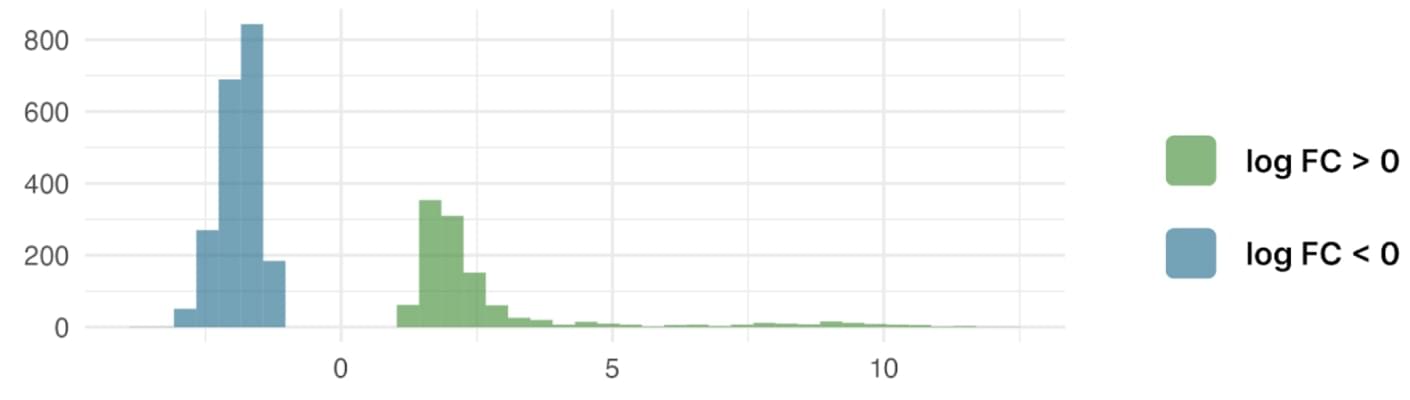 The histogram summarising the distribution of logFC in S. litura infected by nucleopolyhedrovirus and p-value < 0.05
The cells of Spodoptera litura show an active response to infection with nucleopolyhedrovirus: 1136 genes are activated and 2039 genes are repressed. However, compared to S. frugiperda cells treated with different substances and the same virus, fewer genes are differentially expressed - 3175 compared to 33086. Moreover, most of them are downregulated.
The up-regulated genes include retroelement polyprotein, cytochrome P450 and a haemolymph protein. Down-regulated genes include programmed cell death proteins, alcohol dehydrogenases and fatty acid synthases.
This suggests that infection with nucleopolyhedrovirus triggers an immune response in Spodoptera litura (a major component of which is a haemolymph protein) as well as pathways that oxidise xenobiotics (such as cytochrome P450)
Spodoptera exigua challenged with B. thuringiensis VIP3A toxin
4652 genes are differentially expressed in S. exigua after 8 hours of treatment with the toxin. 489 further genes change their expression after 24 hours, resulting in a total of 5141 differentially expressed genes. The upregulated genes include the insulin-related peptide-binding protein, cytochrome p450, the trehalose transporter and a chemosensory protein, which was not observed in other species of Spodoptera after the treatment with active ingredients or viruses.
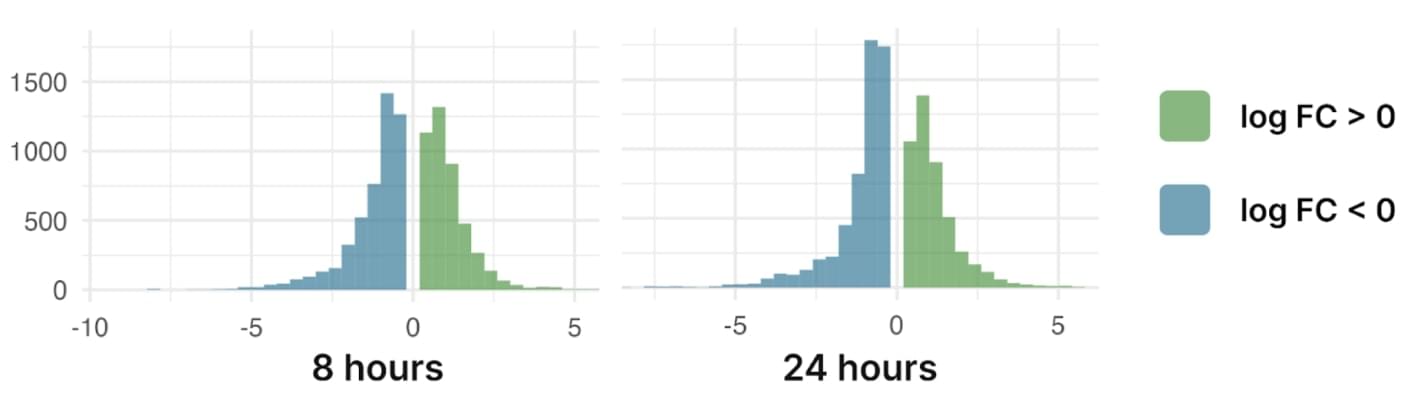 The histogram summarising the distribution of logFC in S. exigua treated with B. thuringiensis VIP3A toxin and p-value < 0.05
Conclusion
We have now analysed how the expression levels of genes change in different Spodoptera species under different conditions. It turned out that some similar signalling pathways are activated upon chemical treatment, viral infection and bacterial toxins. For example, as predicted, we can see a pronounced immune response. But we also observed the gene expression changes that were not expected, such as angiotensin-converting enzymes and phosphatidylethanolamine-binding protein genes expression patterns in Spodoptera frugiperda under nucleopolyhedrovirus. All of that can be used as a ground for further more detailed investigations.
All this work was done in such a short time because we used the Genestack platform to store and harmonise the data. To clean the data, we used a template with scientific ontologies for multiple fields and ran a curation script instead of curating the datasets manually. This saved us up to eleven hours of work, because without ODM it would have taken us about two hours to clean each of the six datasets, with ODM only one for them all. So instead of spending time loading and cleaning the data, we could focus on meaningful work.
We weren’t even slowed down by querying: we used the Jupyter notebook with R and Python, as ODM has packages for both languages. With these packages, we were able to query expression data based on metadata and compare values between different datasets, which saved us another ten to twelve hours.
Everything becomes so much easier when all of your data is available in one place, when it’s harmonised and produced with a single point of truth in mind. Our ODM software, customisable APIs and more allow increased efficiency within your research projects, delivering more meaningful insights that give you an advantage in data management.
If you’re interested in Genestack’s ODM software, and would like to try a demonstration, why not get in touch?
info@genestack.com
genestack.com/products/omics-data-manager/
Literature
- https://entnemdept.ufl.edu/creatures/field/fall_armyworm.htm
- https://www.inaturalist.org/taxa/231425-Spodoptera-exigua
- https://www.inaturalist.org/taxa/124875-Spodoptera-litura
- https://www.ncbi.nlm.nih.gov/geo/
- https://bioconductor.org/packages/release/bioc/html/limma.html
- https://ggplot2.tidyverse.org/
- https://biopython.org/docs/1.75/api/Bio.Blast.html
- https://www.ncbi.nlm.nih.gov/pmc/articles/PMC4351530/
- https://www.sciencedirect.com/science/article/abs/pii/S0965174818303758?via%3Dihub