Radiomics is a new approach for noninvasive tumor subtyping that is showing excellent results. However, integrating radiomics data with other biological modalities, such as OMICS data, is challenging due to the complexity of existing data management systems. In this paper, we demonstrate that ODM (Open Data Manager) is capable of storing various tabular data to enable efficient and streamlined analysis. Our goal was to predict cancer mortality in lower grade glioma patients using TCGA 1 images. By leveraging the capabilities of ODM, we aimed to show that a bioinformatician can perform this analysis in a single day, demonstrating the potential of ODM to facilitate comprehensive radiomics research.
A Platform for Any Tabular Data
ODM can process and integrate any tabular data. Whether it's radiomics, genomics, proteomics, or even financial data, the platform can efficiently store and manage an almost infinite variety of data. In addition, ODM is specifically tailored to the unique requirements of biological data. It provides templates to control metadata and scientific ontologies that ensure standardized annotation and interpretation of biological information. Researchers can define and enforce metadata formats, ensuring consistency in data organization. Furthermore, ODM's advanced query capabilities enable the subdivision of data based on metadata attributes, facilitating efficient data exploration. With its comprehensive support for biological data management, ODM empowers researchers to realize the full potential of their datasets and advance scientific discoveries in a variety of fields.
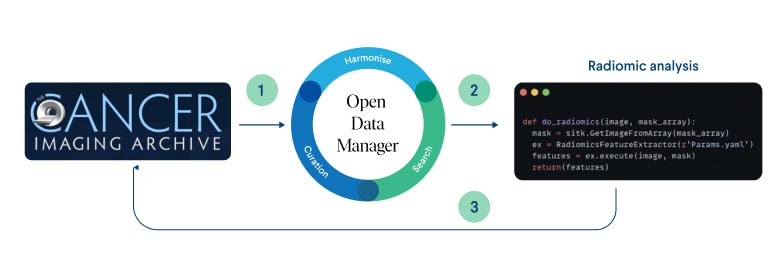 Figure 1: Radiomic analysis data flow in ODM schema
The data flow in our analysis begins with the acquisition of data from the Cancer Genome Atlas (TCGA) 1. This includes radiographic imaging, transcriptomics, proteomics, and pathway information, which is then securely stored and organized in ODM (Open Data Manager), our versatile cloud data storage platform.
Once the TCGA data is loaded into ODM, radiomic analysis is performed to reveal insights and patterns in the imaging data. These radiomic insights provide valuable information on tumor subtyping, prognosis and response to treatment.
Then the results of the radiomics analysis are seamlessly integrated back into ODM. They are attached to the existing dataset in ODM, which already contains transcriptomics, proteomics and pathway data. This integration allows one to gain a holistic view of lower grade glioma samples by leveraging the collective information from multiple Omics modalities.
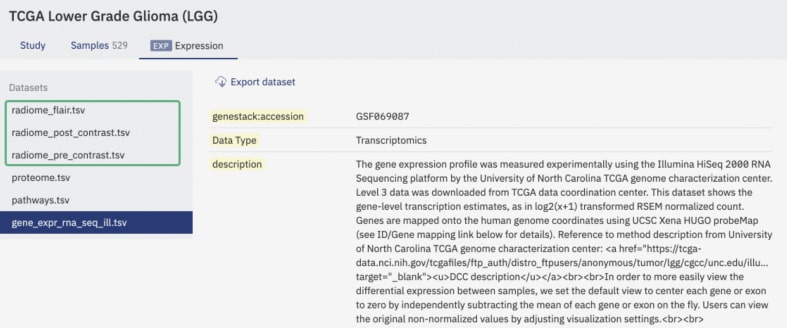 Figure 2: a screenshot of ODM’s interface showing different data types attached to a dataset
Materials and methods
In this study, lower-grade glioma data were obtained from TCGA1 via Xenabrowser. The CT images of tumors, acquired from The Cancer Imaging Archive 2, were in .tif format with 3 channels per image. Radiomics analysis was performed using the Pyradiomics 3 package in Python. For statistical analysis, the one-way method ANOVA of Scipy 4 was used with a significance threshold of 0.05. Machine learning tasks were conducted using scikit-learn 5. These materials and methods enabled the extraction of informative radiomics features from CT scans and the development of predictive models for lower grade glioma analysis.
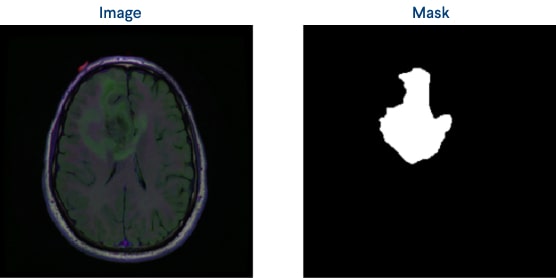 Figure 3: An original image and a mask example
We were provided with CT images in .tif format, each containing three channels: pre-contrast, FLAIR, and post-contrast. In addition, an image-mask pair was available for each image. To extract data from these images, we performed radiomics feature extraction using Pyradiomics 3 packages’ Radiomics Feature Extraction method, which involved extracting 55 features for each channel. These features provide valuable information about the tumor's phenotype, heterogeneity, and other characteristics.
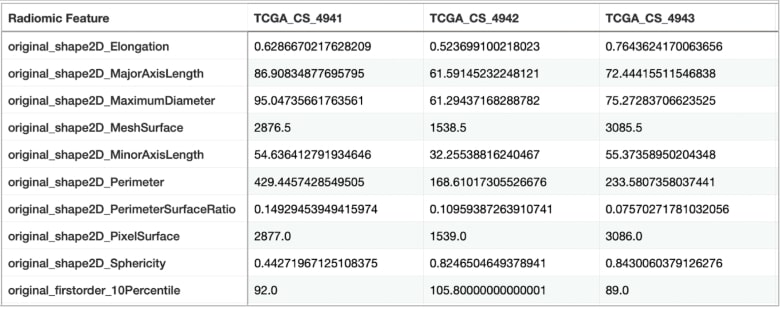 Figure 4: A sample of a table with extracted radiomic features
Next, we utilized the sample metadata to categorize the samples into two groups: dead and alive. To determine the significance of the extracted features, we conducted a one-way ANOVA analysis for each channel, comparing the feature values between the two groups.
Interestingly, statistical analysis revealed that only one feature from the pre-contrast channel showed a significant difference (p-value < 0.05) between the dead and alive groups. Similarly, in the post-contrast channel, two features were also found to be statistically different. However, most different features were observed in the FLAIR channel, suggesting that this channel captures the most important information for both the dead and alive groups.
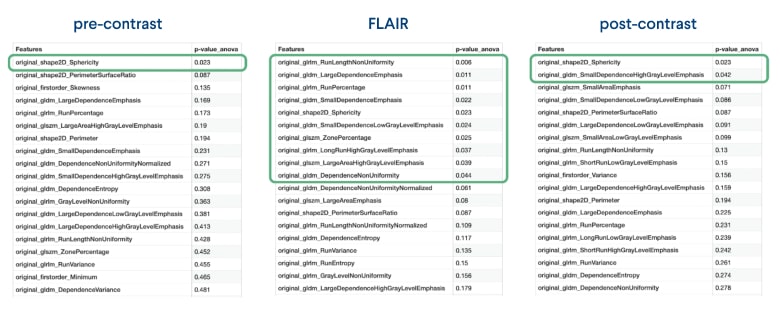 Figure 5: A list of radiomic features per each channel with statistically significant features outlined in green
Given this result, we decided to use the FLAIR channel as the primary input for our machine learning model. By focusing on the FLAIR channel, we can leverage the wealth of information it provides and potentially improve the accuracy of our predictions about patient survival.
Machine learning
In our machine learning analysis, we utilized the Sklearn 5 package in Python to predict patient mortality based on the extracted radiomic features of glioma tumors. Initially, we encountered an imbalance between the two groups, with one group consisting of 55 samples and the other containing only 16 samples. To address this, we employed oversampling techniques to create a balanced dataset for training and testing our models. After testing several algorithms, we found that the random forest algorithm performed best with 62% accuracy using radiomic features alone.
It is worth noting that the proteomics data alone contributed only 53% to the final accuracy. However, by combining it with the radiometric features, we were able to achieve a more robust and accurate cancer mortality prediction model. This successful integration of different types of data was made possible by the ODM data management platform we used, which allowed seamless combination and analysis of different data sources.
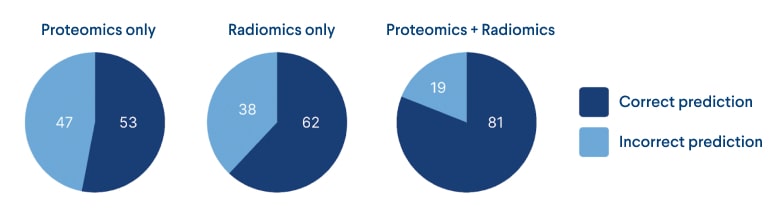 Figure 6: ML models’ performance pie charts for each data type
In summary, our approach involved the development of a machine learning model that used both radiomics and proteomics data to predict cancer mortality. By integrating these data types, we were able to significantly improve the accuracy of our predictions, which ultimately led to more informed decisions about disease progression.
Conclusion
In our study, radiomics was used to predict cancer mortality in lower-grade glioma patients. We achieved 78% accuracy with radiomics alone, which increased to 87% when combined with the results of proteomics and pathway analysis. This success was made possible by ODM, our versatile data management platform that can store any tabular data format and integrate multiple data types. Open Data Manager played a critical role in seamlessly combining different data types and facilitated comprehensive analysis, leading to valuable insights in our research. Overall, our results highlight the potential of radiomics and the importance of advanced data management platforms like ODM to advance precision medicine research.
Open Data Manager
Want to learn more about how to manage your data and join industry leaders like Astrazeneca, Wellcome Sanger, Corteva and Unilever? Find out more at www.genestack.com and get your free product trial today.