
Introduction
The amount of data generated in metabolomics can often be overwhelming, so effective data management is critical for success. Raw data should be appropriately labeled, stored, and organized - so that the information can be easily retrieved when needed, while processed data should be easily accessible for searching and stored in a system. It should also be possible to query signal data based on metadata, allowing selection of samples according to specific criteria without requiring additional time and effort.
Our previous studies have shown that the Genestack platform can easily perform transcriptomics, proteomics and multi-omics analysis. In our latest study, we are investigating the field of dietary supplements by comparing the metabolites of green and black tea using metabolomics analysis.
Genestack’s Open Data Manager For Metabolomics
The management of metabolomics data often gives rise to non-obvious questions that demand careful consideration. For instance, how can different types of biological data be combined? How can analysis results be validated against low throughput data? And what is the most effective means of storing raw data? Let’s address each question separately.
A query that every scientist desires to be able to make:
“Give me all Camelia Sinensis samples infected with pests that have mutation in AT1G01010 and where phenylpropanoid biosynthesis pathway is activated in both transcriptome and metabolome”.
However, running such queries is often time-consuming and complex, as the data is typically generated by various laboratories, stored in disparate systems, and then presented in different formats. Integrating such data requires a significant investment of time and effort. Fortunately, Genestack’s ODM was created explicitly for this purpose. The platform allows researchers to load data in tabular format and execute a single API call across all datasets, dramatically reducing the time needed to generate results. Consequently, the query described above can now be completed in mere seconds, providing scientists with the valuable insights they need to drive their research forward.
Integrating low-throughput datasets with high-throughput OMICS data is another challenge due to the inability of most systems to support different data types. Genestack's ODM solves this problem, allowing for seamless integration of diverse data sources. As an illustration, we have leveraged Genestack's ODM to integrate low-throughput datasets with high-throughput OMICS data in our recent studies. Specifically, we utilized blood counts and dietary information from the UK biobank in one study and proteomics data from patients with atopic dermatitis in another. The flexibility and versatility of ODM allowed for seamless integration of diverse data sources, enabling us to derive valuable insights that would have been difficult to obtain using conventional data storage and analysis approaches.
At the outset of each experiment, sequencer runs produce raw data that can contain several gigabytes in entries. As processing proceeds, additional data sets may be generated with various normalization methods or data subsets. In turn, a metabolism experiment can produce numerous files that need to be stored and associated with respective samples to enable easy retrieval. In the Genestack platform, raw data is typically structured as part of the metadata. For this experiment, we opted to store the raw data in .cef format as part of the sample metadata, as depicted in Figure 1. This approach ensures convenient access to the relevant files for each individual sample, through either the platform's interface or API.
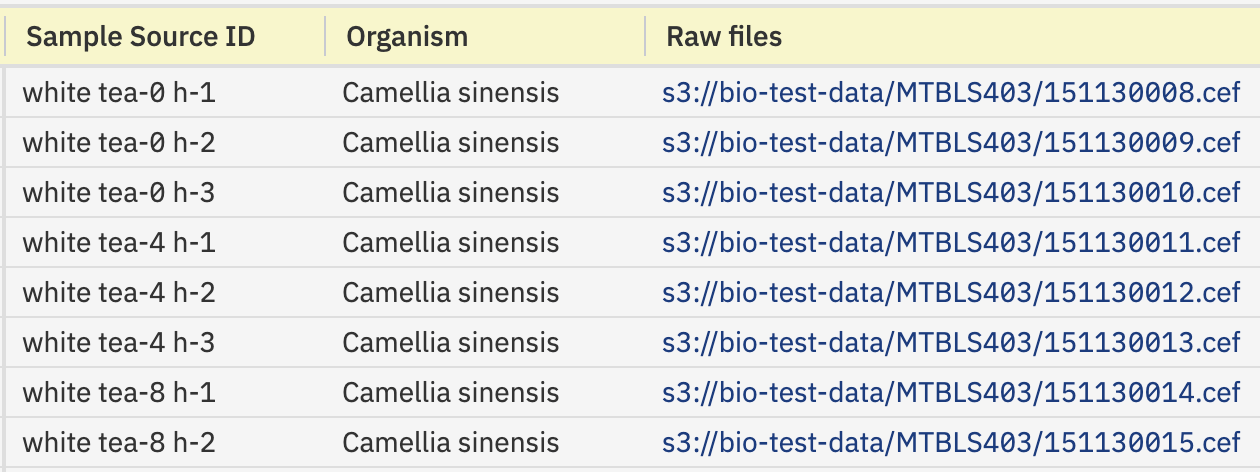 Figure 1. Open Data Manager interface showing raw data handling
Materials and Methods
In this study, ODM was utilized as the main tool for managing, editing, and storing data. The platform's dedicated Python libraries and R packages enabled smooth loading, cleaning, and retrieval of data directly from the Jupyter notebook, which was used as the primary interface for analysis. The advanced features of the Genestack platform were used to streamline data management and simplify the analysis process.
The data was loaded from Metabolights 1 - and analyzed using R programming language with the limma 2 package for differential expression analysis and python with the matplotlib 3 package for drawing plots.
Analysis and Interpretation
Black and green tea both originate from Camellia sinensis, but their distinct processing methods result in differing chemical compositions and metabolites. In order to investigate these differences, we conducted a thorough analysis.
Our results showed that green tea had 62 elevated metabolites, while black tea had only 21. Differential expression was analyzed using the limma package, and the statistical confidence was high, with a p-value greater than 0.05 observed for only 12 out of 104 metabolites analyzed. These findings are illustrated in Figure 2, which displays a pie chart and volcano curve of the results.
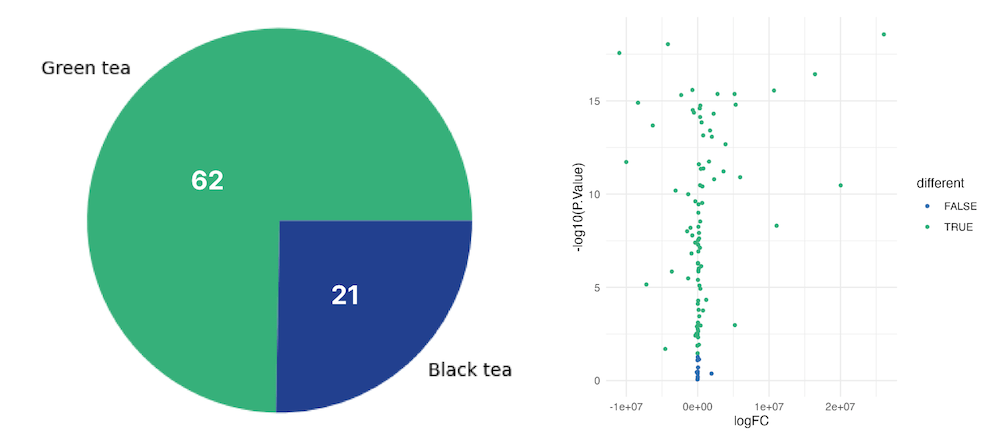 Figure 2. Pie chart and a volcano plot showing the number of differentially expressed genes in each type of tea
Moving forward, we conducted a separate analysis of each type of tea, beginning with green tea. Our analysis revealed numerous elevated metabolites, with Figure 3 displaying the top 8 overexpressed molecules. Upon closer examination, it became evident that the majority of the elevated molecules were catechins. These compounds possess potent antioxidant properties, as they are capable of deactivating reactive oxygen species (ROS) and chelating metal ions. Notably, one of the catechins identified was epigallocatechin gallate (EGCG), which has been studied for its ability to suppress lung cancer cells 4.
Our findings confirmed previous scientific evidence that green tea contains higher levels of antioxidants than black tea 5, further highlighting its potential health benefits. Furthermore, both tea types were found to contain theanine, an amino acid known for its calming effects on the brain. However, green tea was observed to have higher levels of theanine than black tea.
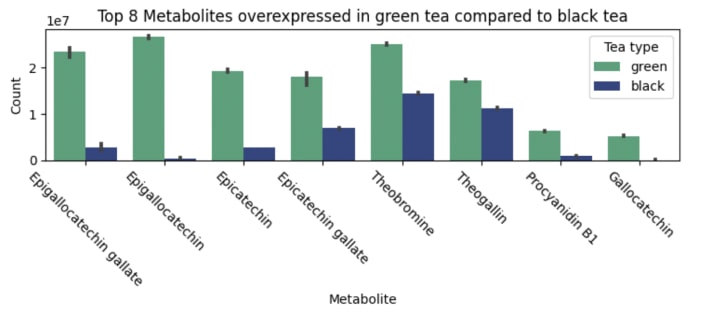 Figure 3. The barplot of overexpressed metabolites in green tea compared to black tea
In our analysis of black tea compared to green tea, we observed that the top elevated metabolites, as shown in Figure 4, were predominantly amino acids. Additionally, black tea exhibited elevated levels of theaflavins and thearubigins, compounds known for imparting the characteristic darker color and richer flavor to the tea. However, a notable finding was the significant downregulation of catechins in black tea. This suggests that black tea may have a lower antioxidant effect compared to green tea.
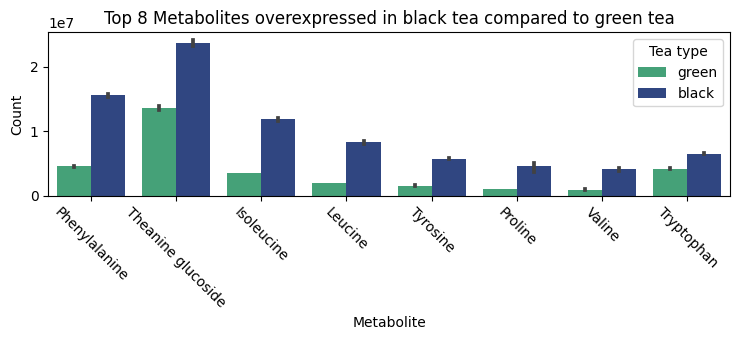 Figure 4. The barplot of overexpressed metabolites in black tea compared to green tea
To summarize, green tea is rich in antioxidants and black tea has an elevated number of theaflavins and thearubigins. According to the literature, those can have anti-inflammatory effects 6 and lead to lower glucose levels 7.
To validate the above findings, we turned to low throughput data from the UK biobank, which provided information on tea consumption, health conditions, and biological samples. Analyzing blood test results, we compared individuals who drank five or more cups of tea per day with those who consumed one or less, and found several positive effects on blood counts. The most significant difference was observed in leukocyte count, which increased from 6.6 to 6.85 (p-value: 1.2e-12). This is consistent with a 2014 study that showed green tea extract, when taken as a dietary supplement for two weeks, can increase leukocyte activity. We also observed a decrease in glucose levels (p-value: 0.0001), with the mean for the high tea consumption group (4.36) lower than that for the low consumption group (4.40). Please refer to figure 5 for details.
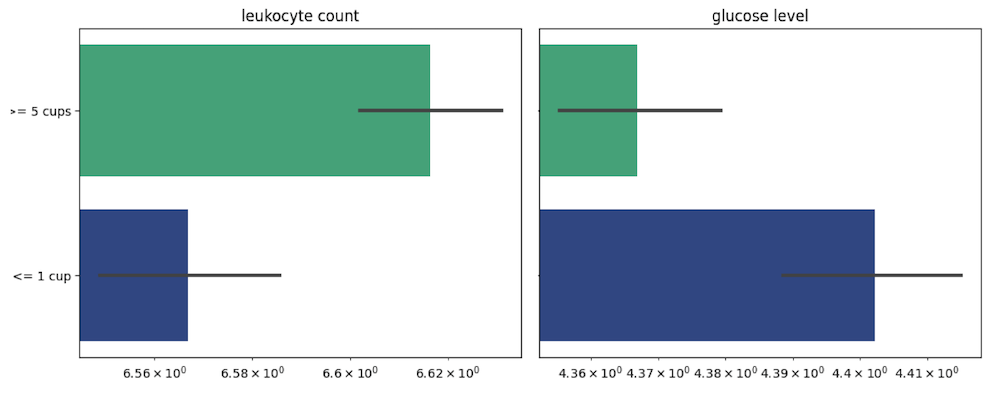 Figure 5. The leukocyte count and a glucose level of individuals from UK Biobank with different amount of tea consumption
Conclusion
The study aimed to investigate the differences between green and black tea at the metabolite level, with a focus on understanding their chemical composition. The findings confirmed previous research that green tea has more antioxidants, while black tea contains more theaflavins and thearubigins. It also showed that individuals who consumed 5 or more cups of tea daily had higher leukocyte counts and lower glucose levels, as validated by the UK Biobank data.
The success of this study was largely due to the use of Genestack ODM, which seamlessly integrated the metabolomics and UK Biobank data in one location for efficient analysis. The powerful API of the platform facilitated the analysis process, allowing for a more streamlined and insightful interpretation of the results. The study's findings provide valuable insights into the potential health benefits of tea consumption and demonstrate the importance of using advanced technology for efficient data analysis.
For those interested in further exploring we invite you to review our other articles.
Contact us for a live demo of the platform and a free trial:
info@genestack.com
https://genestack.com/products/omics-data-manager/
Literature
- https://www.ebi.ac.uk/metabolights/editor/MTBLS403/
- https://bioconductor.org/packages/release/bioc/html/limma.html
- https://matplotlib.org
- https://www.ncbi.nlm.nih.gov/pmc/articles/PMC8505700/
- https://academic.oup.com/jn/article/132/4/785/4687401
- https://pubmed.ncbi.nlm.nih.gov/26259232/
- https://pubmed.ncbi.nlm.nih.gov/23514230/