In our every day life the concepts for data, information and files seem obvious: a file is a structured carrier of a chunk of information (data). Files can then be merged and split if they have a similar structure or can be located in the same folder as other files. In our professional life, “working with data” and “working with files” are essentially therefore the same activities.
In the scientific industry however, working with information provides yet another dimension: data generation as a result of a scientific experiment.
In this article we explore the key requirements of scientific data organization and why the classic file-based paradigm is not applicable.
How we generate data in Life Sciences
In Life Sciences we test a scientific hypothesis by:
- 1. Designing an experiment
- 2. Generating data or evidence
- 3. Analyzing data
- 4. Confirming or rejecting the hypothesis (frequently looping back to the first step).
To prove the hypothesis we need a very firm experimental design (aka Data Model) that would allow generating enough data to reach statistical significance (the exact volume required various depending on various other factors, but in general terms the more data the better, if budget allows).
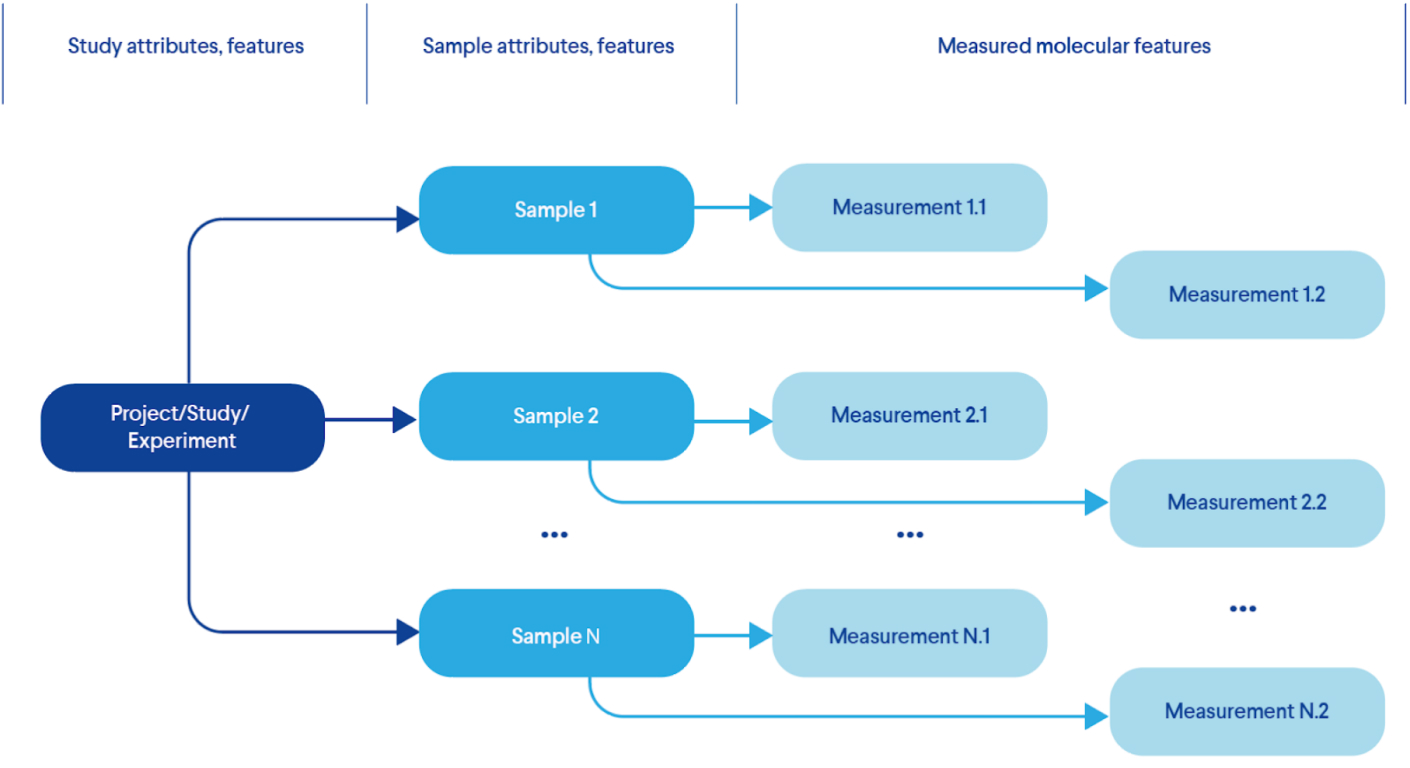
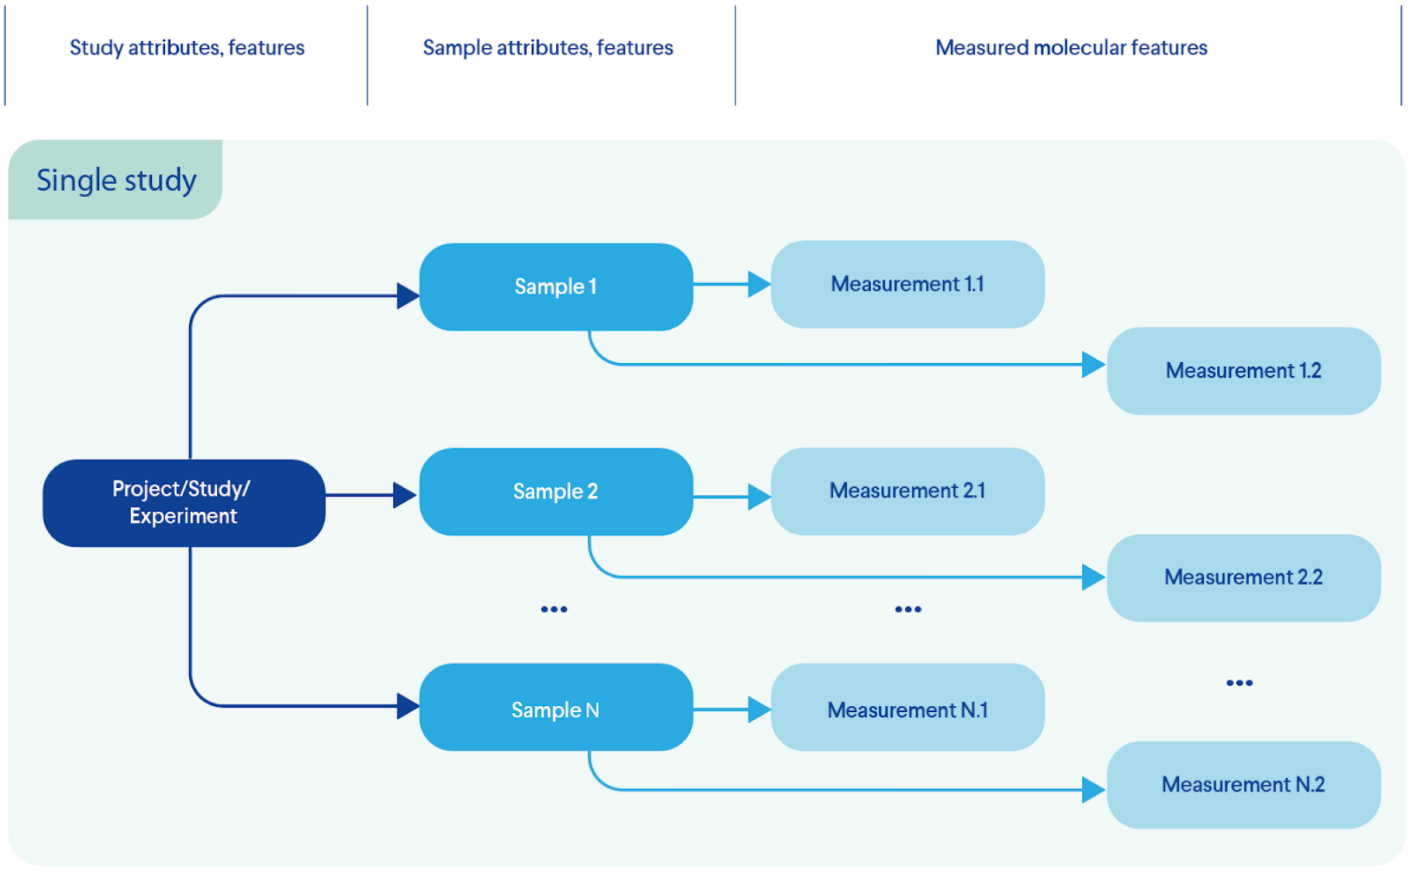
Figure 1 provides an example of the most basic experimental model that describes the features of each test and corresponding measurements:
- 1. First we describe the project itself;
- 2. Then we identify which samples we need to model the theory we want to test;
- 3. Perform the required measurements for each sample using one or more methods.
Real life experimental designs can add more complexity to this model by introducing more nodes in this hierarchical model, including patients, time courses, multiple samples and more.
Figure 1. A Typical Life Sciences Experimental Design (Data Model)
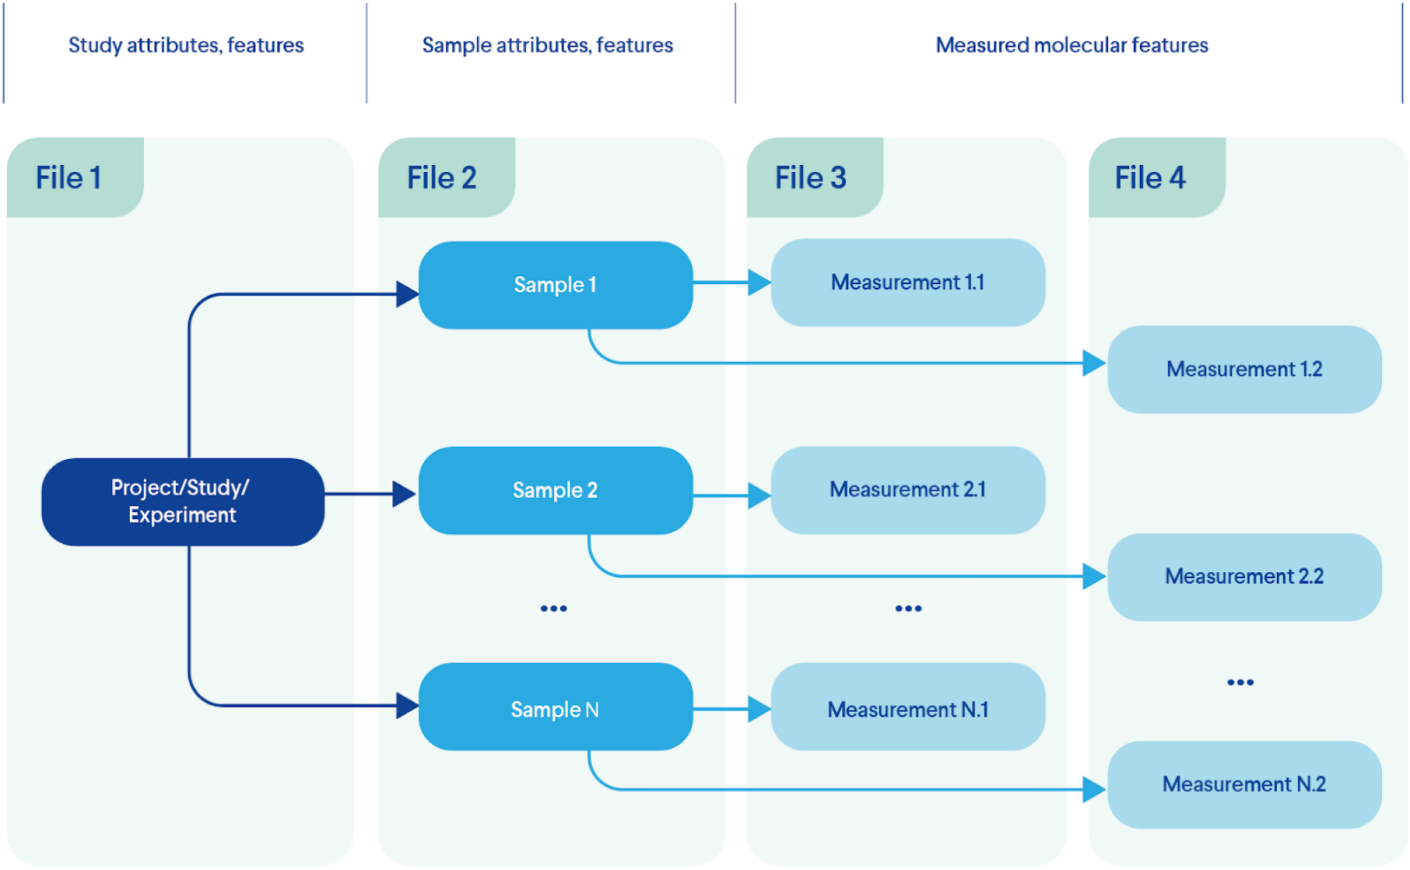
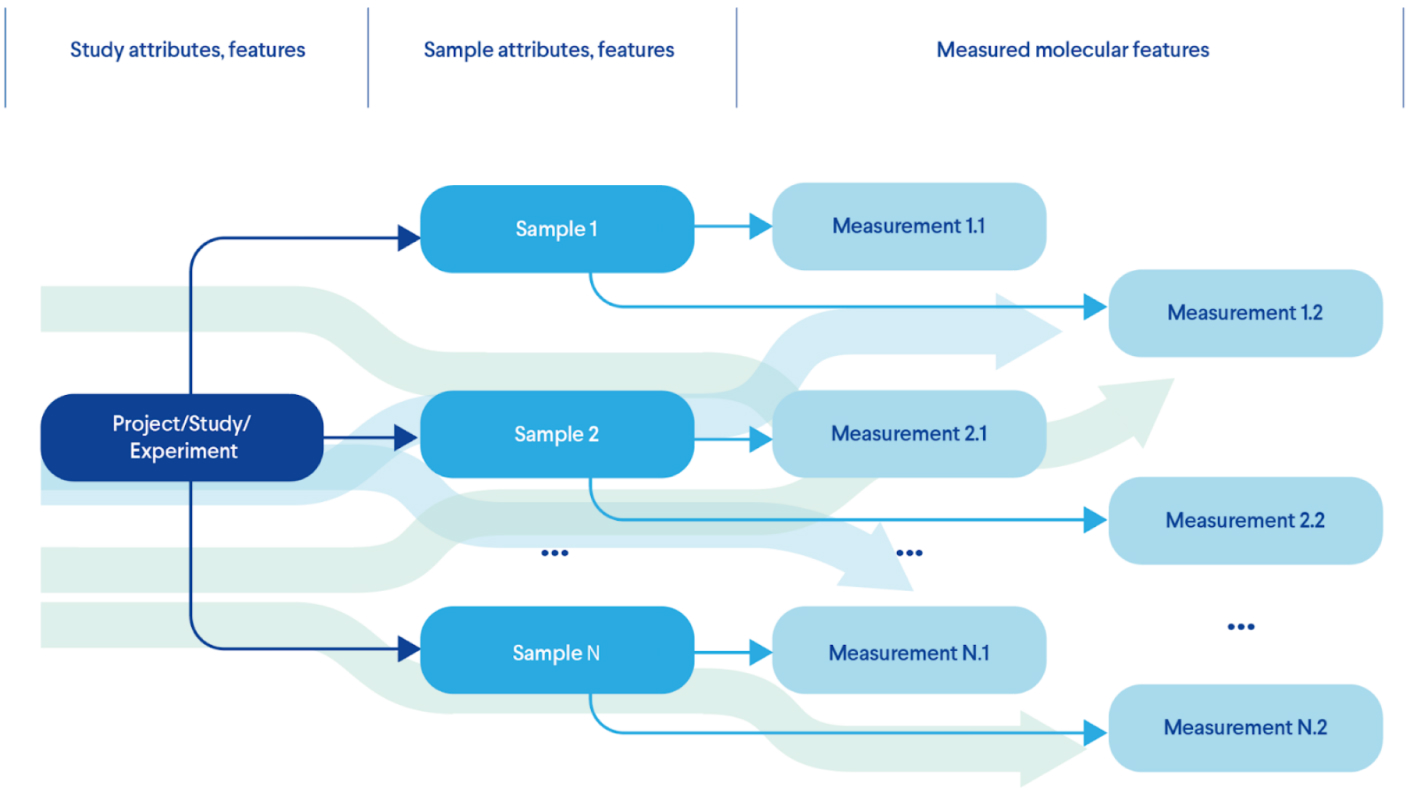
Eventually, the information that describes each entity type (e.g. patients, samples, episodes, measurements, etc.) can be assembled in corresponding files and made available for further analysis and interpretation as demonstrated at Figure 2. For our simplified example experimental model those can be:
- 1. Project information stored in text files including Microsoft or Google docs (in extreme cases it can be scattered across countless emails or messengers);
- 2. Sample data (disease, treatment, tissue, species, other conditions) may be filled in a table file (comma- or tab-separated, Excel, Google Sheet, you name it);
- 3. Measurements file format strongly depends on the method used. From an endless table file with thousands of gene expression measures or millions of gene variants for each sample to JSON or XML formats extracted directly from the measurements device.
In such a case, the information for our elegantly designed experiment is scattered across numerous files where features and measurement of a sample are located in at least two places.
Figure 2. A Typical Information Distribution Across Files
Keeping the scientific experiment information in the standard “data = file” paradigm may work for small isolated projects but nowadays the following challenges make it inefficient:
- 1. People who produce the data are often not those who analyze and interpret it. They can belong to different departments. Files need to be properly described and transferred.
- 2. People who analyze data work with information that can be distributed across multiple files (e.g. find a study where samples are extracted from liver and certain measurements within a particular range).
- 3. A large number of studies. A single organization can have multiple research units generating enormous amounts of data.
- 4. Limited guidelines on data description preventing locating a study simply by its content.
Data Management in LS Requirements
In the context of the challenges above, the LS industry requires a data management solution (or collection of solutions) that can provide a specific set of enabling functionality:
- 1. Data cataloging. A single point of truth for all the data produced in the organization. It could be the place where the data is stored or just keeping all the references to the data whilst it is located elsewhere.
- 2. Data transformation. Ability to extract data distributed across original files and unify them into a virtual structure reflecting the original experimental design (Figure 3 - instead of a collection of four different files we have a single study with individual samples and corresponding measurements). Important for (4).
Figure 3. Transformation: Information extraction from multiple files; creation of single entity that emulates the experimental design (data model)
- 3. Data Curation. Ability to define guidelines of how to describe the features (e.g. creating a rule that each sample must have a “disease” attribute where possible values must come only from a defined list of disease names controlled vocabulary). Ability to transform attributes from user files to match previously defined guidelines. Important for (4).
- 4. Data search and query. An ability to search across the catalog to identify individual studies, samples and/or measurements by their features but not just original files (e.g. Figure 4 - find a study where samples are extracted from liver and certain measurements within a particular range) to form custom subsets of data, virtual cohorts by slicing original dataset and merging them into new ones.
Figure 4. Querying Across Transformed Data
- 5. Data extraction and analysis. An ability to run analytics on a defined study or collection (subset) of samples or/and measurements without manual cut out of the original collection of files.
Closing Remarks
In most cases, data management may seem a straightforward and intuitive concept: just put all the files in the same place. The Life Sciences industry, however, requires interaction with data organized in complex structures to be efficient in research and development.
At Genestack, as scientists doing research in the life sceinces space we saw that there was a distinct lack of tools that could fulfill all of the above requirements. 10 years ago we therefore created Omics Data Manager to allows scientists from the pharmaceutical, agriscience, and consumer goods industries to interact directly with the data and generate insight connecting all experiments and the people who work with them. Find out more at www.Genestack.com