
This article is written by Kelsey Luu, currently a Master's student at Harvard Medical School, who conducted a summer internship project with Genestack in 2021. The project sought to assess the feasibility and attractiveness of AI models to derive better insights from the growing availability of omics datasets. The project was supervised by Kevin Dialdestoro, Head of Data Science at Genestack.
Summary
- We successfully built an AI model that can perform a more integrative gene/pathway analysis compared to the traditional approach of differential gene expression followed by pathway enrichment. The model is flexible and can be naturally extended for multi-omics input.
- Benchmarking simulations demonstrate that our approach is more robust than standard methods.
- The model was applied on curated/re-processed public datasets spanning multiple tissue types and autoimmune diseases, revealing relevant and important biological pathways.
- Deal with the root cause: the data and the search services, not the visual analytics.
- To know in which cell type / tissue / cell line a gene is expressed, the challenge is in harmonizing the metadata and expression data across your private/public experiments
- To stratify individuals by their multi-omics profiles, the challenge is in tracking the diverse subject-sample-data relationships
- To correlate large molecular and phenotypic data, the challenge is to integrate and index them in a scalable manner.
Introduction – Why We Need a More Sophisticated Pathway Analysis
Pathway analysis is a crucial step in understanding disease biology, as perturbed pathways can point us to the key gene(s) that regulate critical disease processes and therefore have the potential to be viable drug targets. Pathways are easily interpretable and provide a link between the observed data, such as gene expression levels, and the mechanism of action of a specific disease.
Currently, the standard approach for identifying perturbed pathways from gene expression data is a disjointed analysis of differential expression followed by pathway enrichment. However, recent publications suggest that more sophisticated AI approaches demonstrate promise as a means for modeling high complexity systems like biological networks. The complexity of biological networks go beyond gene-gene interactions in signalling/metabolic pathways, but also the interplay between multi-omics layers such as genomics, transcriptomics, and proteomics. Thus, we aim to evaluate the feasibility and attractiveness of AI models to derive more robust and novel pathways from the growing availability of multi-omics datasets.
Data – Curated, Reprocessed Autoimmune Expression Datasets
We downloaded publicly accessible and uniformly processed data from the Autoimmune Diseases Explorer (ADEx) data portal, which integrates 82 curated transcriptomics and methylation studies consisting of 5,609 samples spanning five of the most common autoimmune diseases:
- Systemic Lupus Erythematosus (SLE)
- Rheumatoid Arthritis (RA)
- Sjögren’s Syndrome (SjS)
- Systemic Sclerosis (SSc)
- Type 1 Diabetes (T1D)
Additionally, these samples represent seven different tissue types:
- Peripheral blood
- Whole blood
- Synovial membrane
- Skin
- Salivary gland
- Parotid gland
- Saliva
Together with a knowledge base of gene-pathway associations such as Reactome, we leveraged these gene expression datasets to identify pathways that are perturbed in disease states relative to their healthy counterparts.
Comparison of Approaches – Neural Network vs DGE+GSEA
We used a neural network as the backbone for our model. Here, we outline the key differences between our approach against the common approach of performing differential gene expression (DGE) followed by pathway / gene set enrichment analysis (GSEA).

- 1. Neural networks perform an integrated analysis of perturbed genes and pathways using a single model while the DGE+GSEA approach requires two separate analyses.
- 2. Neural networks are capable of learning interactions and incorporating prior knowledge to guide the learning process (e.g. gene-pathway, gene-gene, pathway-pathway interactions) while the DGE+GSEA approach analyzes each gene and pathway independently. The former more accurately reflects biological truth, where genes interact to influence pathways, and pathways interact to drive higher-level processes.
- 3. Neural networks provide a flexible framework that is conducive to multi-omics inputs while the DGE+GSEA approach requires separate analysis of each omics modality followed by downstream integration.
There are other non-neural network approaches that address some of the above limitations, such as SPIA [1] (which takes into account pathway topology) and PARADIGM [2] (which is capable of multi-omics analysis). Evaluation against these more sophisticated approaches was not in the scope of our project and is considered for future work.
Network Architecture – Pathway-Integrated Autoencoder
Our model was inspired by a framework called PASNet – a pathway-associated sparse deep neural network for prognosis prediction from high throughput data [3]. Their architecture begins with the input gene layer, followed by the pathway layer, then an additional hidden layer that represents pathway-pathway interactions before the final output layer that predicts the long-term survival status of a patient. The advantage of this model is that each layer and neuron has a biological meaning, enabling comparisons to be drawn between the activations of neurons in the pathway layer in one survival class vs another. One key aspect of this model is the incorporation of prior knowledge from pathway databases to define connections between the gene and pathway layers, which we adopted into our model.

The specific neural network framework that we chose is an autoencoder. In fields such as image analysis, the autoencoder is a standard architecture for deriving lower dimensional representations of the input data [4]. For this reason, an autoencoder is a logical choice for learning the relationships between genes and pathways (i.e., lower dimensional functional representations of disease states). A standard autoencoder consists of two main components - the encoder and decoder. The encoder is responsible for transforming the input gene expression profiles into a lower dimensional representation, also known as the latent/embedding space representation. The decoder then takes the low dimensional representation generated by the encoder and attempts to reconstruct the original input data.

The modification we adopted from PASNet is the sparse connections between the gene layer and the pathway layer. In place of the fully connected pathway layer, we implemented a custom sparse linear layer using known gene-pathway associations from the Reactome database. This enforces biological accuracy in that only the weights between genes and their corresponding pathways will be trainable, meaning only genes that are relevant to a pathway will influence the activation of said pathway. The sparse linear layer also allows the model to learn both the strength and direction of connections between genes and pathways. This is an important distinction between our approach and standard pathway enrichment analyses like GSEA, which represent gene-pathway associations as binary relationships.
Focusing on whole blood gene expression datasets from ADEx, we trained a single autoencoder model on each dataset.
Model Benchmarking – Autoencoder Outperforms DGE+GSEA
Since the true perturbed pathways are unknown for any given dataset, we cannot directly compare the DGE+GSEA or autoencoder pathways to a ground truth list. Instead, we assessed the robustness of our trained autoencoder model relative to the standard DGE+GSEA approach using two studies matched by: disease, assay, number of samples (of 161 samples each), and class balance (disease to healthy ratio).
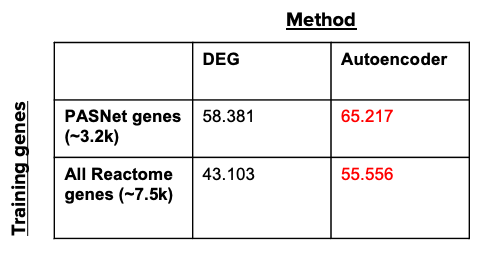
In this example, the disease of interest is SLE (Systemic Lupus Erythematosus). We computed the similarity quotient between the perturbed pathway lists for these two studies using the DGE+GSEA approach (Limma and GSEA in R), then using our trained autoencoder. We assessed both methods using two different sets of training genes: 1) PASNet training genes (genes that belong to Reactome pathways containing at least 10 genes), and 2) the set of all unique genes contained in the Reactome pathways. The following table demonstrates that the autoencoder model outperforms the traditional DGE+GSEA approach (in terms of robustness) regardless of the training genes, suggesting that our approach produces more consistent results for similar experiments.
As a means for assessing the biological quality of the autoencoder results, here we report some of the SLE-relevant pathways that were shared between the two approaches (autoencoder vs DGE+GSEA):
- REACTOME_INTERFERON_SIGNALING
- REACTOME_INTERFERON_ALPHA_BETA_SIGNALING
- REACTOME_CYTOKINE_SIGNALING_IN_IMMUNE_SYSTEM
Previous studies have reported an “interferon signature” in SLE patients in which an upregulation of interferon regulated genes was observed [5]. Specifically, interferon-alpha has been shown to be a dominant mediator in SLE pathogenesis [6]. Moreover, these three pathways are collectively indicative of a pro-inflammatory response characteristic of autoimmune diseases, serving as a promising indicator that our autoencoder model has learned biologically relevant pathways [7].
Web Application – Easily Compare Pathways across Diseases
We developed an R Shiny web application that allows users to easily compare/contrast perturbed pathways across tissue/disease-specific datasets using either the standard DGE+GSEA approach or the autoencoder approach.

Users are also able to refine the pathway lists using set filter operations to view: 1) all pathways for the selected approach, 2) only pathways specific to the selected approach, or 3) pathways shared between the DGE+GSEA and autoencoder approaches.

Users are also able to refine the pathway lists using set filter operations to view: 1) all pathways for the selected approach, 2) only pathways specific to the selected approach, or 3) pathways shared between the DGE+GSEA and autoencoder approaches.
Future Directions – Pathway Validation, Multi-Omics, Architectures
As a next step, we plan to biologically validate the autoencoder-derived pathways through a literature search and consultation with immunology experts. To refine the pathway list, it may be helpful to derive a method for prioritizing pathways that have targetable regulators while filtering out those with housekeeping or critical regulators.
The robustness and biological significance of our approach should be assessed against more comprehensive benchmarking exercises. This includes performance for multi-omics input, sensitivity to assay/disease/tissue types, behaviour with respect to sample size/composition, and stability against “super” pathways (i.e. big pathways with several hundreds of genes) or outlier genes (i.e. genes with very high expression fold changes).
We can also experiment with different autoencoder architectures and training calibrations. For example, we can tune the number of hidden layers, latent space dimensionality, add regularization or dropout, etc.
Additionally, we could experiment with training a single model on all datasets as opposed to training one model on each dataset.
Finally, to enhance the web application, we can add functionalities that allow users to identify genes/pathways that are co-regulated across conditions, which can ultimately guide drug repurposing efforts.
Data/Code Accessibility – Analyze Your Own Data
- Pathway analysis scripts are available, which will process your expression datasets into perturbed pathways, using both the autoencoder model and the standard approach
- R Shiny application is available for biologists to easily view and compare the perturbed pathways side-by-side
- Ultimately, none of these is possible without the availability of standardised, integrated, and well-annotated omics data. Talk to us to see how top-10 pharma, agriscience, FMCG, and research organisations have successfully adopted Genestack’s Omics Data Manager to help accelerate enterprise data reuse and discovery.
References:
- 1. Tarca AL, Draghici S, Khatri P, et al. A novel signaling pathway impact analysis. Bioinformatics. 2009;25(1):75-82. doi:10.1093/bioinformatics/btn577
- 2. Vaske CJ, Benz SC, Sanborn JZ, et al. Inference of patient-specific pathway activities from multi-dimensional cancer genomics data using PARADIGM. Bioinformatics. 2010;26(12):i237-i245. doi:10.1093/bioinformatics/btq182
- 3. Hao, J., Kim, Y., Kim, TK. et al. PASNet: pathway-associated sparse deep neural network for prognosis prediction from high-throughput data. BMC Bioinformatics 19, 510 (2018). https://doi.org/10.1186/s12859-018-2500-z
- 4. Image: https://www.compthree.com/blog/autoencoder/
- 5. Rönnblom L, Leonard DInterferon pathway in SLE: one key to unlocking the mystery of the disease. Lupus Science & Medicine 2019;6:e000270. doi: 10.1136/lupus-2018-000270
- 6. Crow MK. Type I interferon in the pathogenesis of lupus. J Immunol. 2014;192(12):5459-5468. doi:10.4049/jimmunol.1002795
- 7. Moudgil KD, Choubey D. Cytokines in autoimmunity: role in induction, regulation, and treatment. J Interferon Cytokine Res. 2011;31(10):695-703. doi:10.1089/jir.2011.0065